

Canada Markets
Elevator Grain Stocks, by Location, as of Week 19
As of week 19, or the week ended Dec. 11, Prairie producers have delivered 25.503 million metric tons (mmt) of principal field crops into the licensed handling system, up 22.1% from last year and 5.7% higher than the three-year average for this week.
Railway performance has been a concern this crop year while some of the data points to slightly better-than-average levels attained so far. As of week 19, the two major railways have cancelled 5,228 hopper cars, down 3% from the three-year average while outstanding orders are seen at 2,431 cars, down 1.1% from the three-year average.
P[L1] D[0x0] M[300x250] OOP[F] ADUNIT[] T[]
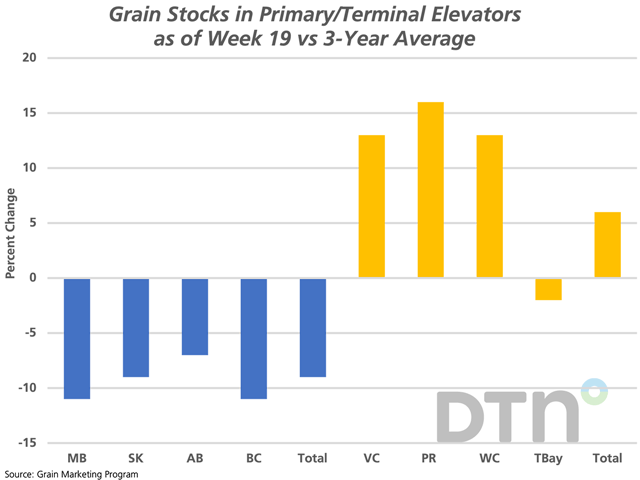
As seen on the attached chart, which the Grain Marketing Program summarizes from weekly Canadian Grain Commission data, country elevator grain stocks (blue bars) are down from the three-year average in the four provinces reported, with the total stocks down 9% from the three-year average.
The yellow bars represent terminal grain stocks, which are higher than average in Vancouver and Prince Rupert, while down slightly from average in Thunder Bay. Total terminal stocks as of week 19 are up 6% overall from average.
Cliff Jamieson can be reached at cliff.jamieson@dtn.com
Follow him on Twitter @Cliff Jamieson
(c) Copyright 2022 DTN, LLC. All rights reserved.

Comments
To comment, please Log In or Join our Community .