

Canada Markets
March HRS Holds Above $9, Again

Editor's Note: Dec. 9 is the last day to register for the DTN Virtual Ag Summit -- free for DTN customers and minimal fee for noncustomers. This year's Ag Summit will be held virtually on the mornings of Dec. 12-13, so you can join from the comfort of your own home. Further details can be found at http://www.dtn.com/… or for even more instructions, see https://www.dtnpf.com/….
**
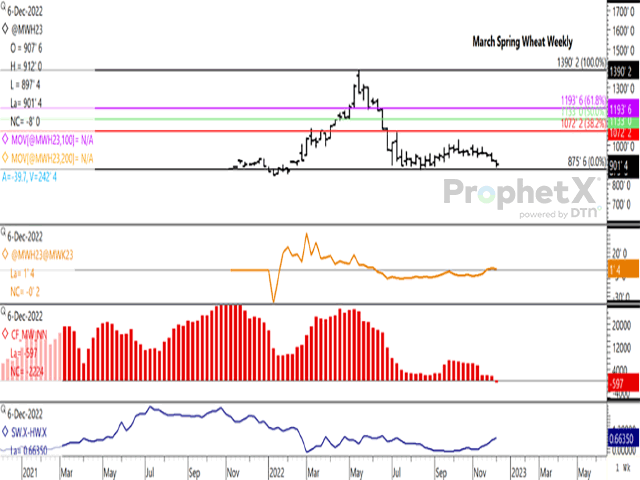
March hard red spring wheat closed 19 3/4 cents lower during the week, ending near the middle of the week's range at $9.01 1/2/bushel (bu). The week's low came within 14 1/4 cents of testing the recent August low of $8.75 3/4.
P[L1] D[0x0] M[300x250] OOP[F] ADUNIT[] T[]
Since the week of July 19, trade has taken place below $9/bushel on the March chart in six of the weeks, only to close at $9/bu or higher each time, including the most recent week. It would seem that the commercial trade remains ready to defend this price level.
The first study shows the March/May futures spread ending in inverted territory for a third consecutive week at 1 1/2 cents. While a modest inverse, it extends forward to the May/July spread, which closed at an inverse of 1 cent this week. Over the past five years, the March/May spread averaged minus 3.35 cents on this date, with an inverse showing in just one of the past five years, which was one year ago.
The red histogram bars on the second study shows noncommercial traders moving to a modest net-short position of 597 contracts as of Dec. 6, the first net-short shown since the week of Oct. 5, 2020, or more than two years. While a bearish move, it does not signal great conviction and could lead to reflection as we start focusing on the potential challenges for 2023.
The lower study shows the spread between the HRS cash price index in the U.S. and the HRW cash index, viewed as a proxy for the demand for higher protein wheat. This spread reached a recent low of minus 20 cents in late September (HRW over HRS), while closed at 66.35 cents this week (HRS over HRW), the highest spread seen since the week of July 11.
Cliff Jamieson can be reached at cliff.jamieson@dtn.com
Follow him on Twitter @Cliff Jamieson
(c) Copyright 2022 DTN, LLC. All rights reserved.
Comments
To comment, please Log In or Join our Community .