Canada Markets
August-to-September Licensed Grain Exports
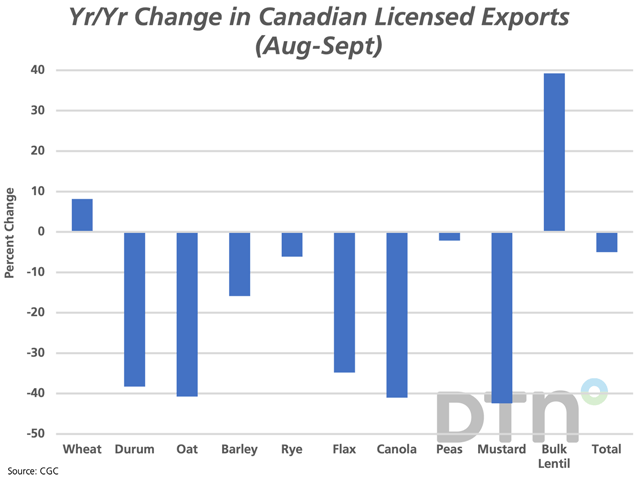
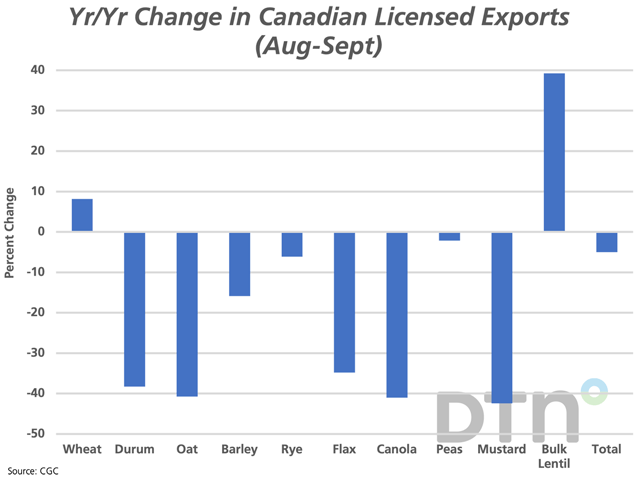
The Canadian Grain Commission reported cumulative exports through licensed facilities are down 5% from last year at 4.8059 million metric tons (mmt), a late start partially linked to tight carry-out stocks from 2021-22, the late harvest along with a cautious sales program. This total volume is down 23.2% from the five-year average for this period.
A year-over-year surge in wheat exports prevented a much sharper drop in total exports. Wheat exports (excluding durum) are up 197,700 mt or 8.1% from the same period last year in the first two months of the year, but note this is 7.2% lower than the five-year average. It is interesting to see that volumes exported to the three largest destinations are up significantly year-over-year, with the volume shipped to China up 115.8% from last year, the volume shipped to Bangladesh up 60.6% and the volume to Japan up 19.8%.
P[L1] D[0x0] M[300x250] OOP[F] ADUNIT[] T[]
Durum exports during the first two months total 355,300 metric tons, down 38.3% from last year and 39.6% below the five-year average for the period. A slightly higher volume has been shipped to Italy than one year ago while the largest change is a 129,800 mt drop in exports to Morocco.
Canola exports over this period are down 41%, while down 72.4% from the five-year average for this two-month period. The year-over-year change in activity shows a modest drop in exports to China of 20,900 mt and a 107,100 mt drop in business with Japan.
Cliff Jamieson can be reached at cliff.jamieson@dtn.com
Follow him on Twitter @Cliff Jamieson
(c) Copyright 2022 DTN, LLC. All rights reserved.


Comments
To comment, please Log In or Join our Community .