

Canada Markets
Soybean Oil Took the Spotlight on Oct. 18

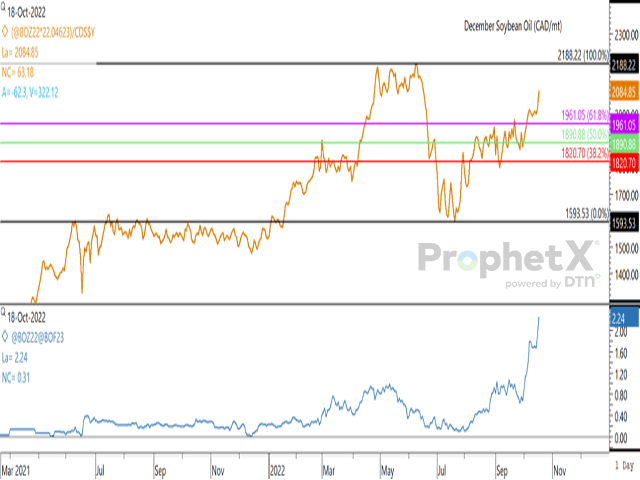
Soybean oil futures posted solid gains for a second session on Oct. 18, led by the front-end December contract, which gained 1.9 cents/lb. USD to close at 68.74 cents/lb. Tuesday's move saw price push further above the contract's 100-day moving average, while reaching its highest trade in 16 weeks, or since the week of June 21. While not shown, this week's move has seen price move above the 50% retracement of the short-term move from the contract's June high to July low, while is already close to testing the 61.8% retracement at 69.79/mt.
P[L1] D[0x0] M[300x250] OOP[F] ADUNIT[] T[]
The brown line on the attached chart shows the move in this contract when presented in Canadian dollars/metric ton. Tuesday's close is seen at $2,084.85/mt, slightly ahead of the close in the Canadian dollar trade, which is the highest seen since mid-June.
The lower study shows the Dec/Jan futures spread or inverse strengthening to 2.24 cents on Tuesday, the largest spread seen over the life of the spread. This is signaling growing demand on the front end. The forward curve for soybean oil is downward sloping, with each contract closing higher than the following contract (inverted trade) through to the July 2025 contract.
Cliff Jamieson can be reached at cliff.jamieson@dtn.com
Follow Cliff Jamieson on Twitter @CliffJamieson
(c) Copyright 2022 DTN, LLC. All rights reserved.
Comments
To comment, please Log In or Join our Community .