

Canada Markets
The Canadian Dollar's Counter-Seasonal Trend
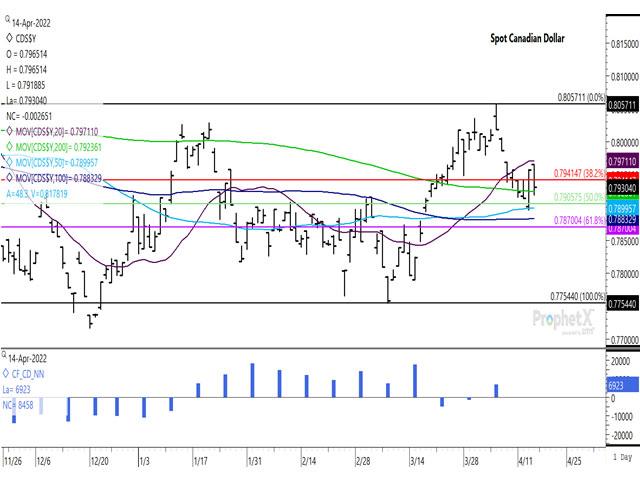
After a sharp 43-basis-point rally against the United States dollar on April 13, April 14 trade closed 27 basis points lower at $0.7930 CAD/USD, finding support at the 200-day moving average for a second session, which is calculated at $0.7924 CAD/USD.
During the week, the Canadian dollar gave up 26 basis points against the USD for a second consecutive lower close on the weekly chart, reaching its weakest trade in four weeks. So far this month, the loonie has corrected 81 basis points lower, currently showing the potential for the first monthly loss in three months.
P[L1] D[0x0] M[300x250] OOP[F] ADUNIT[] T[]
This may be viewed as a counter-seasonal move for the Canadian dollar's exchange with the USD. Equityclock.com shows the exchange rate bottoming in January/February/March on average during the past 20 years, only to begin a rally against the USD in March that sees a seasonal high reached in mid-October. The April monthly gain of 1.3% on average over 20 years is the largest average monthly move seen during the year, while the Canadian dollar has shown strength against the USD in April in 75% of the years during the past 20 years ending Dec. 31, 2021.
This week's weakness comes despite the Bank of Canada's 0.5 percentage point rate hike announced on April 13, the largest monthly increase seen in more than 22 years. As well, crude oil strengthened by $8.69/barrel USD or 8.8% this week, which also failed to prevent today's daily loss and the weekly loss.
The blue histogram bars on the lower study shows investors moving from a bullish net long to a bearish net-short and back in recent weeks, searching for direction. CFTC data will updated on April 17.
Cliff Jamieson can be reached at cliff.jamieson@dtn.com
Follow him on Twitter @Cliff Jamieson
(c) Copyright 2022 DTN, LLC. All rights reserved.

Comments
To comment, please Log In or Join our Community .