

Canada Markets
USDA's Global Canola/Rapeseed Balance Sheet
The USDA's January: World Oilseeds and Trade shows a modest 917,000 metric ton (mt) upward revision in global canola/rapeseed production, with production estimated higher in India, European Union and Australia. The result is global production estimated at 69.269 million metric tons (mmt), the highest monthly estimate in five months.
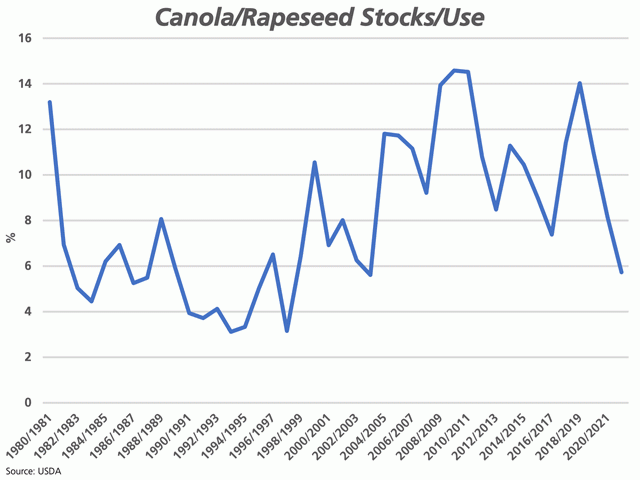
At the same time, global consumption was revised 1.143 mmt higher this month, the highest seen in six months. Seed is disappearing quicker than it can be found on paper. Global stocks are estimated to fall for a third straight year to 4.084 mmt, the lowest seen since 2003-04.
P[L1] D[0x0] M[300x250] OOP[F] ADUNIT[] T[]
As a percentage of global use, stocks are calculated at 5.7% of global use, poised to fall for a third year, while close to the 2003-04 low of 5.6%.
This number can fall further. In five of the eight crop years for 1990-91 to 1997-08, this ratio ranged from 3.1% to 3.9%.
Cliff Jamieson can be reached at cliff.jamieson@dtn.com
Follow him on Twitter @Cliff Jamieson
(c) Copyright 2022 DTN, LLC. All rights reserved.

Comments
To comment, please Log In or Join our Community .