Canada Markets
Another Tough Week for HRS
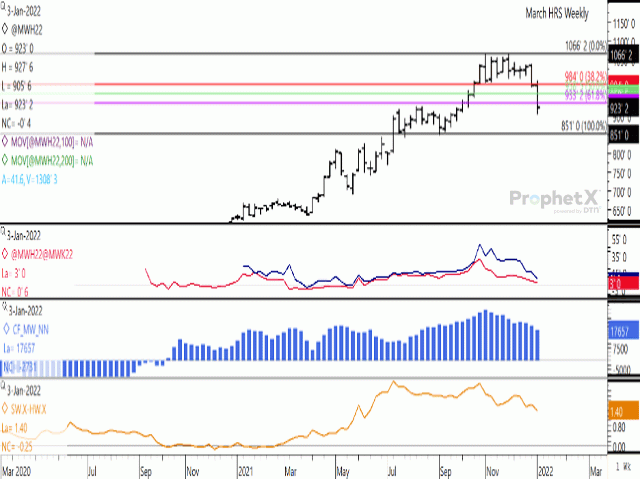
Late-session selling this session pushed spring wheat futures back into negative territory, with the March contract ending down 1/2 cent at $9.23 1/4/bushel (bu), while the daily chart shows close to a perfect doji bar or candlestick formed this session (not shown), with today's open only 1/4 cent below today's close, which often signals a market turn and bears watching.
The March MGEX hard red spring wheat contract has fallen by 58 3/4 cents during the week, while the two-week move of $1.09 1/4 is the largest two-week correction seen since June 2011 on the continuous active chart.
P[L1] D[0x0] M[300x250] OOP[F] ADUNIT[] T[]
As seen on the weekly chart, this week's move closed below the 61.8% retracement of the move from the contract's September low to November high, calculated at $9.33 1/4. The weekly chart indicates there's little potential support between this week's low and the September low of $8.51/bu, although potential support lies at $9/bu on the daily chart along with the 200-day moving average of $8.73/bu.
The lines on the first study show the futures spreads continuing to weaken, signaling a less bullish view of fundamentals held. The red line shows the March/May futures spread closing at 3 cents for the week (March over the May contract), still viewed as a bullish spread, but down sharply from the 31 1/2-cent inverse reported for the week of Oct. 25 and weaker for a fifth consecutive week.
The brown line on the lower study shows the HRS/HRW cash price spread based on DTN's U.S. cash market indices. This spread acts as a proxy for the demand for higher quality protein wheat, which fell to $1.40/bu as of Jan. 6, the lowest calculated since mid-June.
The real risk for this market lies with the noncommercial net-long position, seen at 17,657 contracts as of Jan 4, as seen by the blue histogram bars on the middle study. The size of this position has fallen in seven of the past nine weeks to 17,657 contracts as of Jan. 4. This position had grown to 29,470 contracts as of Nov. 1, while it has since fallen by 40% during the months of November and December. This signals that this noncommercial liquidation may continue. The stochastic momentum indicators on the weekly chart (not shown) are near the middle of the neutral zone, trending lower, while also supporting the idea that this downward move may have further potential.
Cliff Jamieson can be reached at cliff.jamieson@dtn.com
Follow him on Twitter @Cliff Jamieson
(c) Copyright 2022 DTN, LLC. All rights reserved.


Comments
To comment, please Log In or Join our Community .