

Canada Markets
A Look at the Pace of Canola Exports
It will be a race to the finish line as both crushers and exporters attempt to secure canola as supplies tighten. During the past five weeks, Canadian Grain Commission data shows the volume reported for domestic disappearance exceeding the volume exported in four of the five weeks. This weekly difference (domestic disappearance less exports) averaged close to 39,000 metric tons per week during the five weeks, while ranging as high as 96,700 mt in week 36.
Buyers with the greatest need will be easily spotted by the cash bids reported, although posted bids and what is actually being paid may vary greatly. This week, the track Vancouver basis was reported to strengthen by $10/mt to $105/mt over the July contract, while one prairie crusher has priced July/first-half August delivery as high as $100/mt over the July contract delivered to prairie plants, encouraging producers to store seed into summer.
This month's Agriculture and Agri-Food Canada supply and demand tables show demand forecasts for 2020-21 canola demand holding steady, with the export forecast left at 10.9 million metric tons and domestic disappearance forecast unchanged at 10.350 mmt.
P[L1] D[0x0] M[300x250] OOP[F] ADUNIT[] T[]
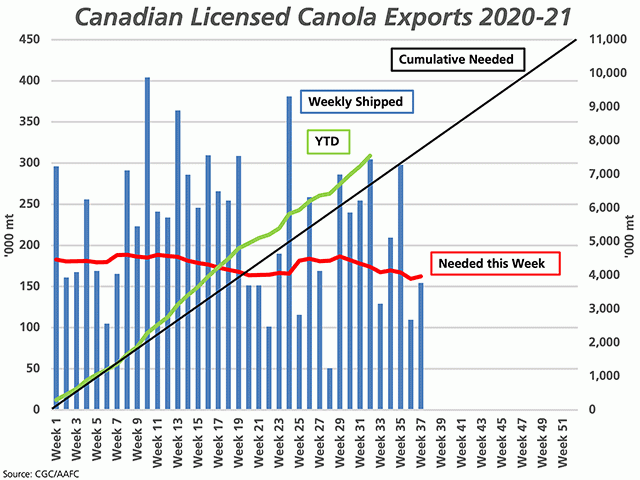
Looking at the attached chart, week 37 exports of 154,400 mt (blue bars measured against the primary vertical axis) is just short of the 162,500 mt needed this week to reach the current demand forecast (red line). This is only the third time in the past nine weeks that the weekly volume has fallen short of the volume needed to stay on track. During the balance of the crop year, roughly 162,300 mt must be shipped each week through licensed channels to reach the current forecast, while only nine of the past 37 weeks have seen the weekly volume fall below this level.
The upward sloping green line on the attached chart shows the cumulative volume shipped at 8.465 mmt, which is 709,231 mt higher than the steady pace required to reach the current export demand forecast, as indicated by the upward-sloping black line, both measured against the secondary vertical axis.
Producer deliveries remain encouraging. In week 37, producers delivered 377,100 mt into licensed facilities, down from the 455,400 mt delivered in the week before, while roughly 10,000 mt higher than the three-year average for this week. This is despite cumulative data that shows cumulative deliveries at 16.228 mmt, up 1.779 mmt, or 11.9% from the same period last crop year.
Commercial stocks fell during the week to 1.574 mmt, although remain 25.8% higher than the three-year average for this week, leaving commercials well-covered as we near spring seeding. Two-thirds of this volume remains instore primary elevators on the Prairies.
Railway performance has improved in the most recent data, with week 36 data showing both railways spotting 91% of the cars wanted for loading, the most recent data available. As of the April 22 Daily Network Status report from the AG Transport Coalition, port unloads were reported at 1,674 in total for the day, up 169 from the previous day, while the daily average this week is reported at 1,565 cars, or 17% higher than the previous week.
Cliff Jamieson can be reached at cliff.jamieson@dtn.com
Follow him on Twitter @Cliff Jamieson
(c) Copyright 2021 DTN, LLC. All rights reserved.

Comments
To comment, please Log In or Join our Community .