Canada Markets
A Look at the Old-Crop/New-Crop Corn Price Relationship for Ontario
When it comes to 2021 grain markets, there seems far more questions than answers. This week's headlines show France importing wheat from Romania; Brazil removing import tariffs on corn, soybeans, soybean oil and soymeal in order to curb internal price inflation directly following a record soybean harvest; and Canadian buyers set to import rapeseed from Ukraine for August shipment. Global trading patterns are being shifted in new directions while focus lies on new crop potential.
A quick look at DTN's range of Ontario cash bids reported on April 19 shows the most common new-crop bid for corn at $6.20/bushel CAD. Looking back in weekly price data reported by Ontario's ag ministry each month, we haven't seen a posted new-crop bid over $6/bushel (bu) since week 40 of 2012, when this price was reported at $6.40/bu. Note that this government cash data is based on prices for the Chatham-Kent region of the province.
P[L1] D[0x0] M[300x250] OOP[F] ADUNIT[] T[]
At first look, this seems a good place to start pricing. If that becomes your lowest price sale of the year, it still looks good. At the same time, it is interesting to look at the Ontario government's old-crop and new crop data and the historical relation between the two.
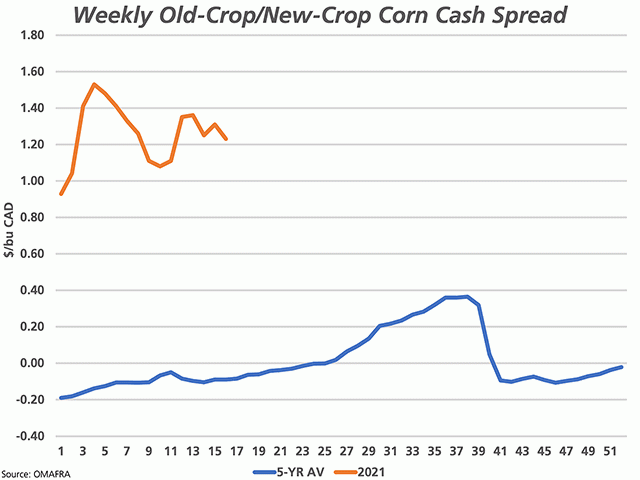
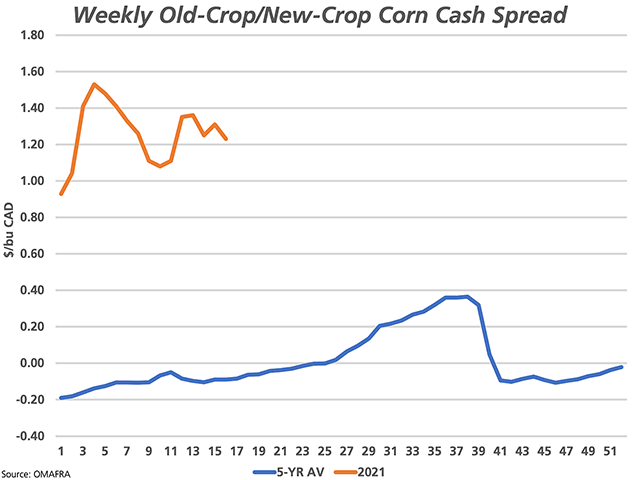
On April 19, the most common old-crop bid was shown at $1.50 over the May contract or $7.42/bu. This reflects a $1.22 premium to new crop. On average during the past five years, Ontario's price data shows the new-crop bid trading at an $0.08/bu carry or premium to old crop, trading higher than old-crop in three of the past five years (week 17 data). The brown line on the attached chart shows this trend during the current calendar year, with the government's data for the first 10 weeks extended by six weeks to week 16 or the week-ending April 16 using ProphetX data.
This trend bears watching. Developments on the supply-and-demand side during the coming months will help shape this relationship. The question is can this spread narrow and move closer towards its historical trend, or will this spread remain wide, perhaps even strengthening, which could see old-crop pull new crop even higher.
Cliff Jamieson can be reached at cliff.jamieson@dtn.com
Follow him on Twitter @Cliff Jamieson
(c) Copyright 2021 DTN, LLC. All rights reserved.


Comments
To comment, please Log In or Join our Community .