Canada Markets
Statistics Canada February Trade Data
A combination of falling Canadian exports and imports in February led to a $.2 billion drop in Canada's trade surplus to $1 billion, although this still reflects the first time since December 2016 since Statistics Canada reported a trade surplus for two consecutive months. Canada has not experienced a trade surplus over three consecutive months since September 2014.
The broad farm, fishing and intermediate food products group reported exports of $3.364 billion for February, down 9.5% from the previous month, the lowest reported in six months but still 29% higher than the pre-pandemic level reported for February 2020.
As we do each month, the following is a look at exports of grains and related products, with a focus on those crops where the monthly data provides a more complete account of activity when compared to weekly Canadian Grain Commission data.
Canada exported 115,298 metric tons of lentils in February, a month that saw an extended period of brutally cold weather slow activity on the Prairies. This volume is up from January, while the smallest January movement in five years. The largest volume was shipped to Turkey (28.4%) with Bangladesh following at 19.5% of the total volume. Year-to-date exports total 1.414 million metric tons, up 11.4% from the same period in 2019-20 and 1.5% higher than the five-year average. Shipments are behind the steady pace needed to reach the current 2.7 mmt forecast for 2020-21.
Dry pea exports totaled 306,979 mt in February, the largest monthly volume shipped in four months and the largest February shipments ever. China continues to dominate movement, with 233,207 mt or 76% of the total volume shipped in this direction. Year-to-date exports total 2.444 mmt, up 9.3% from the same period in 2019-20 and 22.8% higher than the five-year average. Cumulative shipments have reached 64.3% of the current 3.8 mmt Agriculture and Agri-Food Canada export forecast, ahead of the pace needed to reach this forecast.
Chickpea exports in February totaled 14,706 mt, the largest monthly volume shipped since April 2019 with Pakistan stepping up for 57% of this volume. Cumulative exports total 64,832 mt, up 12.1% from the same period last crop year but represent 83.2% of the three-year average for this period. This pace is equal to the steady pace needed to reach the current 110,000-mt export forecast from AAFC.
Canary seed exports in February totaled 14,285 mt, the largest volume shipped in three months and the largest February movement in at least 10 years. Year-to-date exports total 92,132 mt, 95% of the volume shipped in this period of 2019-20 while 7.4% higher than the five-year average.
P[L1] D[0x0] M[300x250] OOP[F] ADUNIT[] T[]
Mustard exports in February totaled 8,252 mt, the lowest monthly volume shipped in six months. The United States (51.5%) and Belgium (23.6%) continue to dominate these shipments, with the percentage of monthly shipments in brackets. So far this crop year, 62,562 mt has been exported, close to 98% of the volume shipped in the same period of 2019-20, while 6.4% below the five-year average. Cumulative shipments reflect 56.9% of the current 110,000 mt export forecast from AAFC, close to the steady pace needed to reach this forecast.
Exports of flax in February total 56,578 mt, the second-largest monthly volume shipped this crop year. Belgium (46%) and China (34.2%) dominated the volume shipped in February. Cumulative exports total 324,700 mt, up 109% from the same period last crop year and 16.5% higher than the five-year average. To-date, 60% of the current AAFC export forecast of 540,000 mt has been achieved, just slightly ahead of the pace needed to reach AAFC's forecast of 540,000 mt.
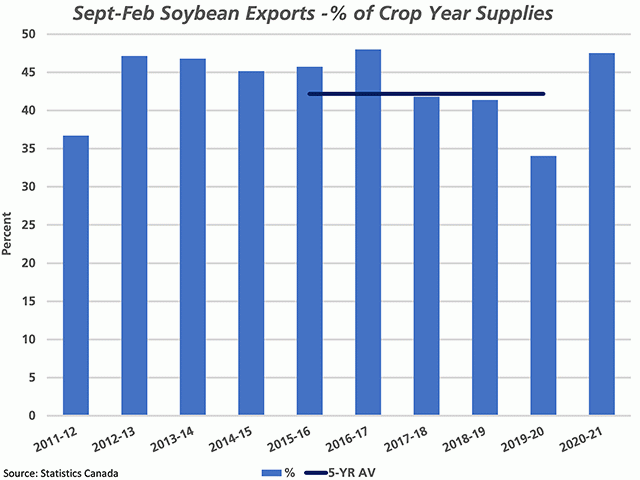
February exports of soybeans were reported at 238,180 mt, falling for a third straight month while to the lowest level in five months. At the same time, this represents the highest February shipments in three years. The largest volume, or 69,600 mt, was shipped to Bangladesh, pushing Iran to second spot in the 38 destinations listed for February shipments. Despite tensions, China was shipped 29,184 mt in February, although this was the smallest volume shipped to China in four months. Year-to-date, 3.511 mmt has been exported, up 45.5% from last year while 5.1% higher than the five-year average. Cumulative shipments have reached 79.5% of the current 4.4 mmt forecast released by AAFC, with the row-crop crop year only 50% complete.
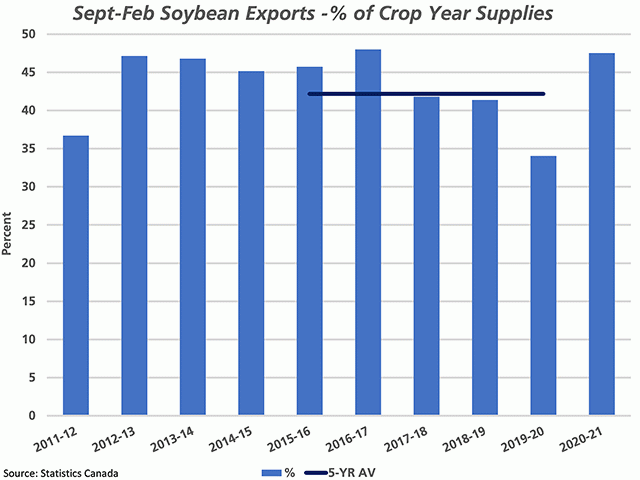
As seen on the attached chart, current exports represent 47.5% of AAFC's estimate for 2020-21 supplies for the first six months of the row crop crop-year. This is the highest percentage calculated since this period in 2016-17.
Canada shipped 50,390 mt of corn in February, with 61.2% of this volume destined for Spain. This was the smallest volume shipped in five months, or since August. Cumulative corn exports total 547,990 mt, up 278% from the same period last crop year and 14.5% higher than the five-year average. Cumulative exports total just 39.1% of the current AAFC forecast of 1.4 mmt, well-behind the steady pace needed to reach this forecast with February representing the first 50% of the 2020-21 crop year.
Canada imported 117,868 mt of corn in February, up slightly from the previous month and the largest monthly volume imported in four months. During the first six months of the 2020-21 row-crop crop year, Canada has imported 750,480 mt, close to the steady pace to reach the current AAFC forecast of 1.6 mmt.
Oat exports totaled 147,492 mt in February, up from the previous month. Cumulative exports total 1.408 mmt, up 22.7% from the same period in 2019-20 and 7.4% higher than the five-year average. Cumulative exports account for 39.6% of the current AAFC forecast of 2.9 mmt, behind the steady pace needed to reach this forecast after seven months.
Barley exports were reported at 327,234 mt in February, with movement almost exclusively to China. This is the largest seen in three months, while cumulative exports are shown at 2.109 mmt, up 67.5% from one year ago and 96.9% higher than the five-year average. Cumulative exports of barley represent 39% of the current AAFC forecast for total exports of 3.7 mmt, which also includes products such as malt.
Canola oil exports totaled 251,589 mt in February, the smallest volume shipped in five months while likely linked to challenging weather during the month. Cumulative shipments of 1.898 mmt is down 1.6% from the same period in 2019-20 while is 4.3% higher than the three-year average.
Canola meal exports in February totaled 405,563 mt, the lowest volume shipped in five months. Cumulative shipments of 2.993 mmt are 8% higher than one year ago and 13% higher than the five-year average.
Ethanol imports totaled 63.4 million litres, down for a third month, the lowest volume of imports seen this crop year and the lowest February imports seen in seven years of data checked. During the first seven months of the August-to-July crop year, 710 million litres has been imported, down 5.3% from last year and 3% below the three-year average.
One quick comment on wheat exports (excluding durum): Cumulative wheat exports as of February, or the first seven months of the crop year, totals 11.896 mmt, which is 526,000 mt higher than the CGC's week 30 report. This points to unlicensed exports of 526,000 mt so far this crop year, which compares to 278,000 mt calculated for the same period in 2019-20.
Cliff Jamieson can be reached at cliff.jamieson@dtn.com
Follow him on Twitter @Cliff Jamieson
(c) Copyright 2021 DTN, LLC. All rights reserved.


Comments
To comment, please Log In or Join our Community .