Canada Markets
May Signals a Potential Reversal
Canola futures have moved into uncharted territory this week, with record highs reached on both the continuous chart and the continuous active chart. After reaching a contract high of $782.90/metric ton on Wednesday, the May contract lost $10.60/mt as nervous investors booked profits. While prices started the day higher on Thursday, a bearish turn seen in the soy complex led to further liquidation in canola to result in a further $30/mt loss.
May soybeans flashed a bearish outside reversal on its daily chart this session, trading above the mid-January high to reach a fresh contract, high, only to turn lower to trade and close below Wednesday's low. Daily volume is reported at the highest level seen during the life of the contract at 175,156 contracts. So far this week, the May/July soybean futures spread has weakened 2 1/4 cents to an inverse of 10 cents (May trading over the July), which is the weakest inverse seen in eight weeks.
P[L1] D[0x0] M[300x250] OOP[F] ADUNIT[] T[]
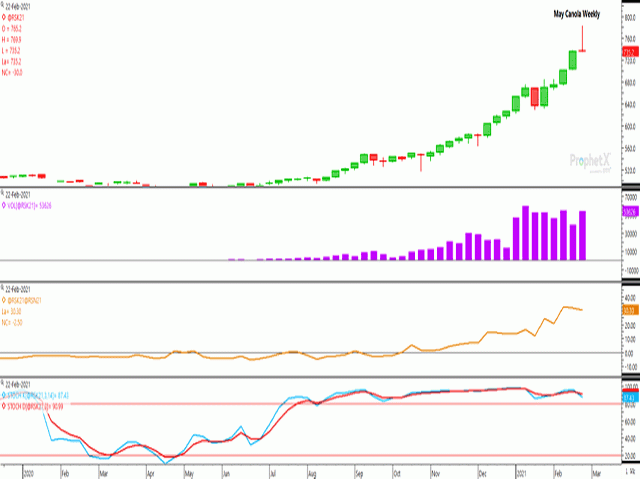
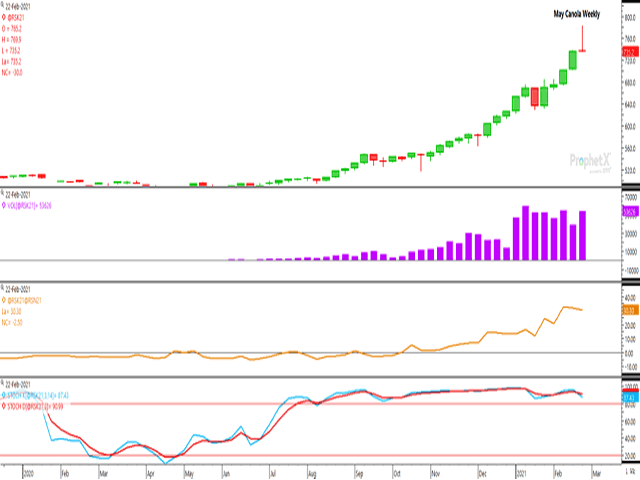
As seen on the attached weekly chart for May canola, a troubling signal is also seen on the weekly candlestick chart, as indicated by this week's red candlestick that resembles an inverted T, also known as a gravestone doji that often signals a market reversal. This candlestick is formed by this week's open at $737/mt, a move to a record high of $782.90/mt, while the Feb. 25 close is at $735.20/mt, also equal to this week's low.
By definition, the bulls dominated trade early in the week, while sellers have taken charge in the past two sessions. This candlestick often signals a trend change. Traders often look to volume charts to help confirm this signal, while after four sessions, the weekly volume is relatively close to the highest volume traded over the life of the contract, as seen in the purple bars of the first study.
The brown line on the second study of the chart shows a modest $1.50/mt weakening in the May/July futures spread over the week, while the spread continues to reflect a bullish $30.30/mt inverse after four days.
The lower study shows a bearish crossing of stochastic momentum indicators during the first four days of the week, although it is early to know if these indicators will continue to roll over to trend lower.
Cliff Jamieson can be reached at cliff.jamieson@dtn.com
Follow Cliff Jamieson on Twitter @CliffJamieson
(c) Copyright 2021 DTN, LLC. All rights reserved.


Comments
To comment, please Log In or Join our Community .