

Canada Markets
Technical Signals on the May Canola Chart
While it is widely established that canola's fundamentals are tight, a situation that has seen the nearby March contract reach its highest trade since March 2008 this week, we will hopefully have a greater appreciation when the next stocks report for Dec. 31 is rolled out by Statistics Canada on Feb. 5.
Valuable perspective is seen in this week's DTN ProMarket Wire Cash Commentary written by Errol Anderson, indicating "At some point, old-crop canola could suddenly spiral lower (demand shuts down)." Buyers may be less apt to take on positions, given the uncertainty of covering sales as we near the bottom of the prairie bins. It could be a situation where one does not want to be the last person on the Prairies to sell.
One producer chat site points to comments made of some grain companies already pointing to a lack of interest in front-end positions and in some cases, elevator space is available only late in the crop year.
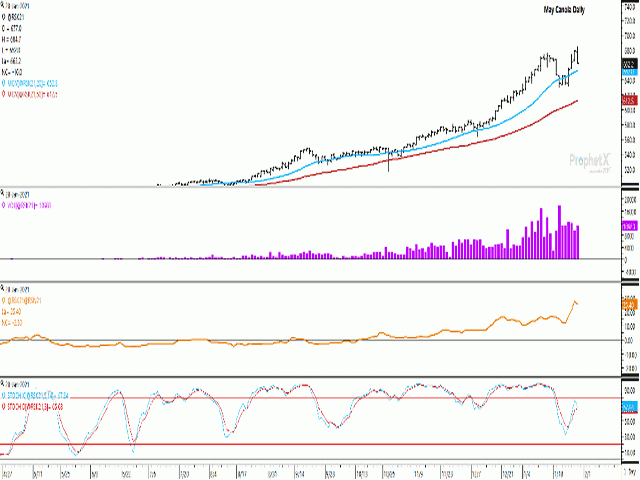
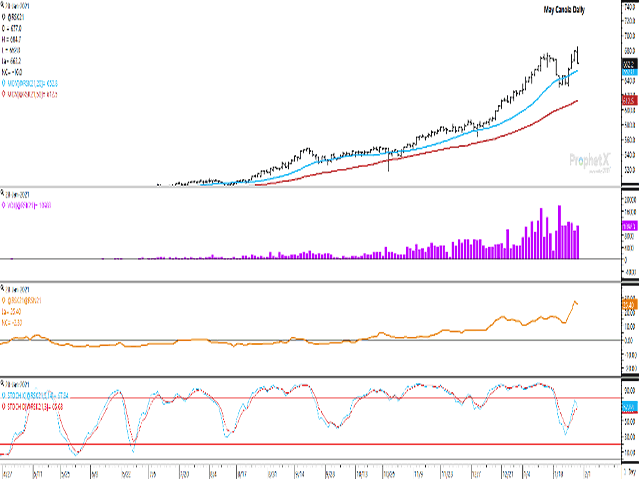
Today's focus is strictly on technical signals on the May daily chart. While several of the same signals are seen in the nearby March contract, trade volume on Thursday slightly favored the May contract with 10,983 contracts trading, as compared to 10,537 contracts in the March one.
P[L1] D[0x0] M[300x250] OOP[F] ADUNIT[] T[]
The May daily chart shows a fresh contract high reached for a second straight day, although Jan. 28 move was met with resistance due to noncommercial profit-taking that led to the first lower close for the week. The May ended $7.50/mt lower at $670.70/mt. While today's close remains solidly above the contract's 20-day moving average at $653.20/mt and the 50-day at $612.70/mt, today's price action did print a bearish outside-day trading bar, trading both higher and lower than the Jan. 27 trading range, while closing lower, a bearish signal.
The histogram bars of the first study shows the daily volume of 10,983 contracts, slightly below the average of the past four sessions, while it should be noted that the Jan. 28 volume that led to a losing session exceeded the Jan. 27 volume that resulted in a higher close.
The brown line on the second study shows the May/July spread weakening $2.10/mt this session to a $25.60/mt inverse, signaling a slightly less bullish view of fundamentals. This spread has more than doubled from the $12.20/mt inverse shown on Jan. 22 to a high of $27.70/mt high reached on Jan. 27.
The lower study shows the stochastic momentum indicators potentially rolling over while in the neutral zone on the chart. This is not the most bearish of turns, which are reserved for a change in direction while in overbought territory or above 80 on the chart.
While the Jan. 28 price action could be little more than normal price move in a continued uptrend, these signals do bear watching.
**
DTN 360 Poll
This week's poll asks what you think of the change in the U.S. administrations. You can weigh in with your thoughts on this poll found on the lower-right side of your DTN Home Page.
Cliff Jamieson can be reached at cliff.jamieson@dtn.com
Follow him on Twitter @CliffJamieson
(c) Copyright 2021 DTN, LLC. All rights reserved.
Comments
To comment, please Log In or Join our Community .