Canada Markets
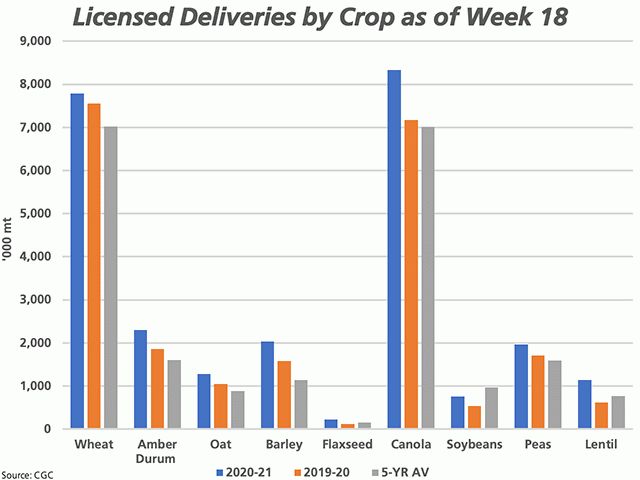
Licensed Deliveries by Crop as of Week 18
As of week 18, producers have delivered 26.191 million metric tons of all principal field crops into Canada's licensed facilities, up 3.625 mmt or 16.1% from the same period in 2019-20 and 4.731 mmt or 22% higher than the five-year average.
An early harvest, a high-quality harvest, record movement seen by railways early in the crop year and a run in market prices have combined to provide opportunity for producers, along with a sharp rise in global demand for grains.
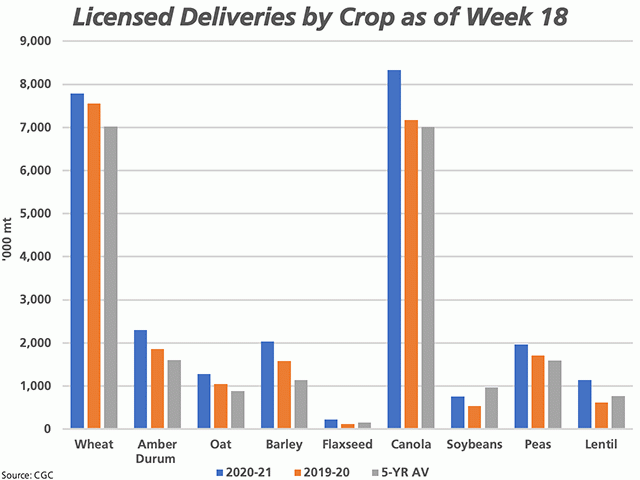
As seen on the attached chart, deliveries of wheat and canola stand out from all other crops. Producers have delivered 7.783 mmt of wheat (excluding durum) as of week 18, up 3% from last year and 10.9% from the five-year average. In addition, canola deliveries at 8.326 mmt are up 16% from last year and 18% above the five-year average.
P[L1] D[0x0] M[300x250] OOP[F] ADUNIT[] T[]
Canadian Grain Commission data shows week 17 deliveries of all crops at 1.6102 mmt, the largest volume in eight weeks as producers deliver on December contracts, while week 18 shows only a modest decline to 1.5735 mmt, which is 25.3% higher than the three-year average for this week and 21.6% higher than the five-year average.
The exception on the chart is soybeans. Prairie soybean production on the Prairies is estimated to have fallen for a third consecutive year in 2020, from a high of 2.7 mmt or 35.3% of the national total in 2017, to 1.231 mmt in 2020, or 19.4% of the national total. Deliveries into licensed elevators have fallen on the Prairies due to lower supplies.
Country elevator space is seen tightening. Week 18 primary elevator inventory across the Prairies and northern British Columbia is reported at 4.3714 mmt, the highest seen in four weeks. This includes a week-over-week reduction in both Manitoba and Saskatchewan stocks, a very modest increase in B.C. stocks and a much larger increase seen in Alberta.
The total prairie grain inventory represents 83.7% of the estimated working capacity used by Quorum Corporation in its calculations, with Saskatchewan at 81.5% of working capacity, Manitoba at 85% and Alberta at 85.9%. British Columbia's inventory is calculated at 112% of estimated working capacity.
The heavy front-end deliveries along with higher prices will have implications for the industry as we move into the final two-thirds of the crop year. In many cases, strengthening futures have done the heavy lifting in contributing to the higher cash prices, while for example, we've pointed to weaker-than-average canola basis across most of the Prairies in recent weeks. Buyers may be forced to sharpen their pencils and get creative in order to pull grain out of the bin in the upcoming months.
This will also lead to price risk for buyers of smaller competing crops, such as feed grains and oats, where sellers may be content to sit back and watch the market rather than market on the front end.
Cliff Jamieson can be reached at cliff.jamieson@dtn.com
Follow him on Twitter @CliffJamieson
(c) Copyright 2020 DTN, LLC. All rights reserved.


Comments
To comment, please Log In or Join our Community .