Canada Markets
AAFC's Nov. Estimates show continued Caution
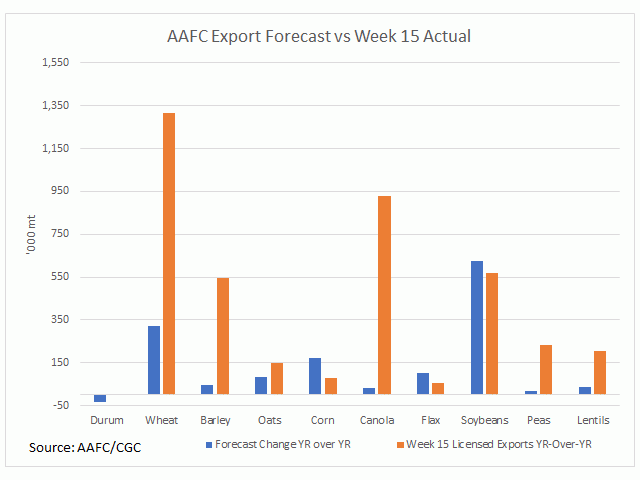
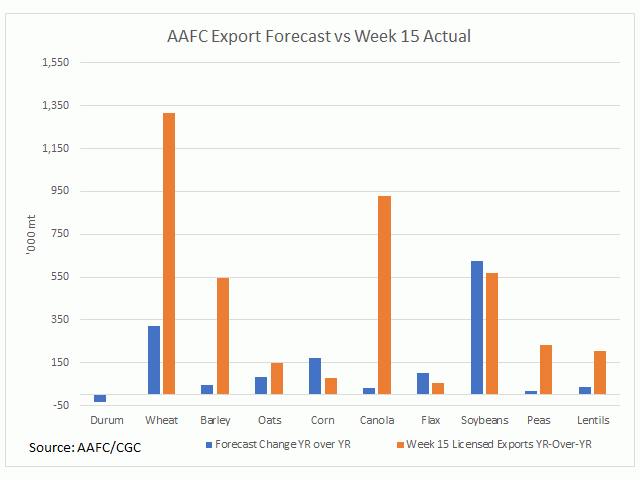
Agriculture and Agri-Food Canada remains cautious in its export demand forecast for 2020-21 in its latest November release, highlighted in data released for the country's biggest crops as seen on the attached chart.
AAFC's Canada: Outlook for Principal Field Crops report for November included an upward revision in Canada's wheat exports (excluding durum) from 19.2 million metric tons to 19.450 mmt, up 322,000 metric tons from the volume exported in 2019-20, as indicated by the blue bar on the chart. Commentary points to a 2% increase in exports due to increased demand from China. Despite higher exports and a modest year-over-year increase in forecast demand, ending stocks are forecast to rise by 15.5% to 5.5 mmt, while also above the five-year average of 4.7 mmt.
This forecast is despite the Canadian Grain Commission's data that shows cumulative exports of wheat through licensed facilities at 6.1169 mmt as of week 15, or the week ending Nov. 15, which is 1.3 mmt higher than the same period last crop year, as indicated by the brown bar on the chart. When the average pace of movement is considered during the past five years, an average of 26.7% of total wheat exports are realized as of week 15 licensed exports, a pace that would lead to an ongoing aggressive pace of shipments that would pull ending stocks down well-below last year's level rather than see a build in inventory this crop year.
P[L1] D[0x0] M[300x250] OOP[F] ADUNIT[] T[]
A similar situation is seen for canola, as seen on the chart. AAFC increased its estimated average price for track Vancouver trade to $560/mt, up $20/mt from last month and $76/mt higher than the 2019-20 average, yet exports were left unchanged this month at 10.2 mmt, up just 30,000 mt from 2019-20. Meanwhile, the CGC is reporting week 15 exports at 3.660 mmt, up 929,800 mt from the same period last crop year and roughly 717,400 mt ahead of the steady pace needed to reach the current 10.2 mmt export forecast.
While not shown, the same can be said for domestic crush. The Nov. 20 Canadian Canola Board Margin Index was reported at $119.92/mt, up 18.4% from the same day in 2019. While there is every reason to crush, the current forecast would suggest that 9.8 mmt will be crush this year, down from 10.129 mmt crushed in 2019-20.
Commentary points to tightening supplies curtailing both crush and exports, but this is after the latest stocks report included upward revisions to the 2018-19 and 2019-20 and ending stocks are still high at 2.250 mmt.
The soybean data can be viewed similar to canola. While the forecast change in year-over-year exports (blue bar) is actually higher than the year-over-year change in licensed exports (brown bar, based on week 5 through week 15 data), exports were left unchanged this month despite an upward revision in the average producer price while ending stocks are forecast to fall only modestly from the record high reached in 2019-20.
It would appear that AAFC either sees demand curtailed later in the crop year or may be expecting a smaller crop size when Statistics Canada reports on Dec. 3.
Cliff Jamieson can be reached at cliff.jamieson@dtn.com
Follow him on Twitter @Cliff Jamieson
(c) Copyright 2020 DTN, LLC. All rights reserved.


Comments
To comment, please Log In or Join our Community .