Canada Markets
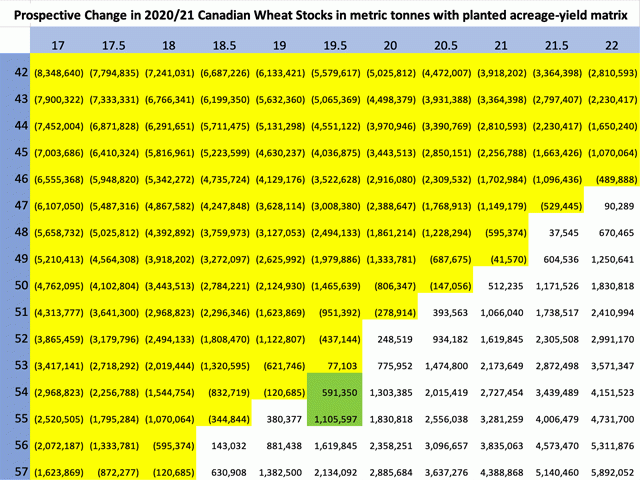
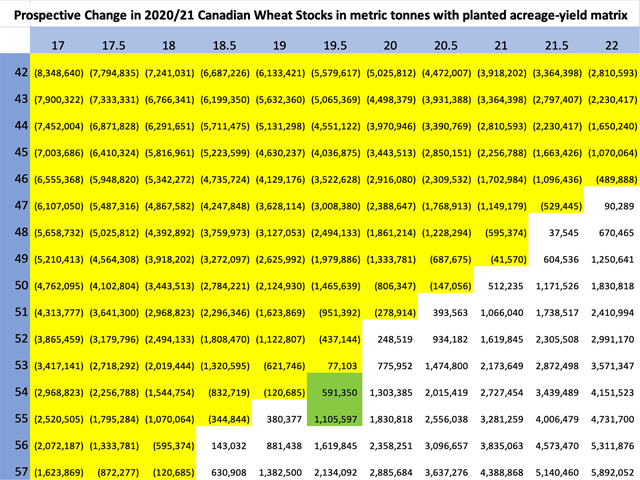
Canadian Wheat Acreage and Yield vs. Ending Stocks Matrix
Statistics Canada's July 31 stocks of Canada's all-wheat (excluding durum) have been estimated at 4.763 million metric tons, the final estimate for 2019-20, up from 4.209 mmt in 2019-20 and below the five-year average of 4.954 mmt. Agriculture and Agri-Food Canada's current supply and demand tables estimate stocks will increase further to 5.2 mmt, with an increase in both beginning stocks and production forecast for 2020-21, while current estimates have both exports and domestic use close to unchanged from the previous crop year.
Ahead of the Dec. 3 final production estimates from Statistics Canada, we look at the manner in which various combinations of seeded acres, as seen on the attached chart's horizontal scale, and yields, seen on the vertical axis, combine to affect 2020-21 ending stocks, leaving demand fixed across the chart.
Results in the boxes shaded yellow represent yield and acreage combinations that would lead to lower ending stocks in 2020-21, while data in the white boxes represents the combination of yield and acres that would contribute to higher stocks. Current Statistics Canada estimates point to an average yield of 54.5 bushels per acre and seeded acres of 19.5 million acres, therefore, the green shaded area approximates the year-over-year change in stocks given the current forecast.
P[L1] D[0x0] M[300x250] OOP[F] ADUNIT[] T[]
While this exercise leaves the demand side fixed in order to calculate the year-over-year change in stocks, which is exactly what AAFC has done in its year-over-year forecast, the current pace of exports could lead to much tighter stocks this crop year.
Over the past five crop years, an average of 15.9% of total wheat exports (excluding durum) have been realized as of the week 9 cumulative volume reported by the Canadian Grain Commission. While this percentage was calculated at 19.2% for 2015-16, the calculation shows a tight range during the past four years, from 14.4% to 16% of total export shipments. Using the five-year average, this would project forward to 23.6 mmt of wheat exported this crop year, well-above the current forecast of 19.2 mmt and would easily achieve record movement. The four-year average would project forward to even higher volumes move.
**
DTN 360 Poll
This week's poll asks what you think will be the largest challenge faced this crop year? This poll can be found on the lower-right side of your DTN Canada Home Page. We welcome and thank you for sharing your opinion.
Cliff Jamieson can be reached at cliff.jamieson@dtn.com
Follow Cliff Jamieson on Twitter @Cliff Jamieson
(c) Copyright 2020 DTN, LLC. All rights reserved.


Comments
To comment, please Log In or Join our Community .