Canada Markets
Historical August-December Production Revisions
The debate continues over the size of the prairie crop as harvest pushes towards the finish line. On Sept. 30, Alberta's Premier Jason Kenny stated that "we believe that this may be the single biggest year in the history of Alberta agriculture, with perhaps a bumper crop across the Canadian Prairies and here in Alberta."
Alberta's Crop Report as of Sept. shows the crop yield index for the province at 112.2% of the five-year average, signaling an above-average crop will be harvested. At the same time, challenging conditions over recent years and wet conditions across northern areas of the province in 2020 make may skew the data. Three producers interviewed for the same media piece that quoted the Premier's optimism all show some degree of skepticism or reservation that 2020 will amount to a record. "We will have to see as the bushels get counted," stated Alberta Federation of Agriculture's Lynn Jacobson.
As discussed in recent weeks, there remains a gap between the Saskatchewan government's estimates when compared to the model-based results released by Statistics Canada. The biggest discrepancy lies with canola, with the Saskatchewan government estimating canola yield at 35 bushels per acre (bpa), as compared to the Statistics Canada estimate of 39.6 bpa. Saskatchewan's durum estimate is 1.9 bpa lower and the province's spring wheat yield is estimated at roughly 2.6 bpa lower. This becomes significant when applied across estimated harvested acres of 11.260 million acres of canola, 4.5 ma of durum and 7.9 ma of spring wheat.
Today's Dow Jones ICE canola commentary has an unnamed trader pointing to the uncertainty of prairie canola production, stating that the supply is "semi-comfy for now," despite producer deliveries into licensed facilities over the first eight weeks of the crop year that are more than 1 million metric tons higher than last year and 34% higher than the five-year average.
P[L1] D[0x0] M[300x250] OOP[F] ADUNIT[] T[]
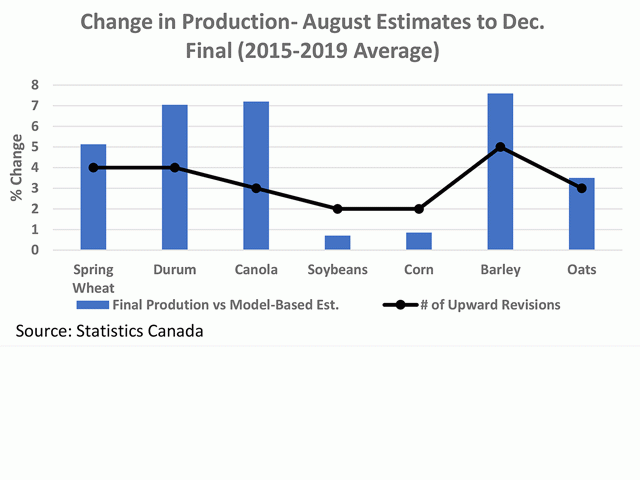
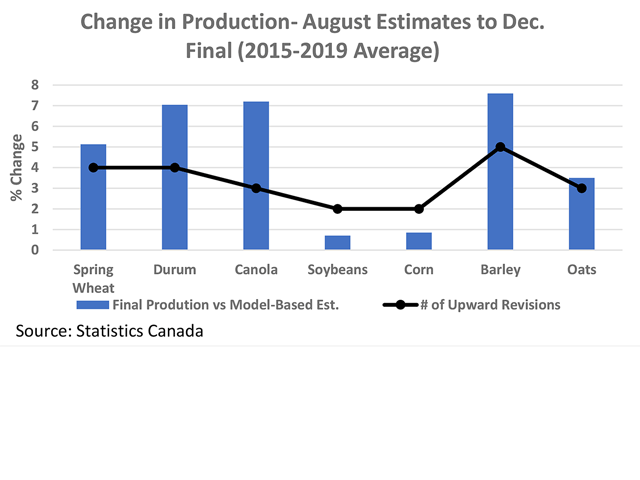
The attached chart shows the tendency for the crop production estimate to grow in size from the model-based estimates based on August conditions to the final November estimates released in early December, while ignoring subsequent revisions. By no means is this a forecast for what is to happen in 2020.
Of the selected crops, the average over the past five years (2015 through 2019) shows production for all crops revised higher. The largest revisions on average, as seen by the blue bars, is seen for barley with an average 7.6% increase, canola at 7.2% and durum at 7%. Final row crop estimates are much closer to the August estimates, averaging 0.7% higher for soybeans and 0.9% higher for corn.
The black line with markers shows the number of times over the five years 2015-2019 period that production has been revised higher. In each of the past five years, the estimate for barley has been revised higher in the final estimates released in December. In the case of the row crops, the crop size has been revised higher in only two of the five years.
**
DTN 360 Poll
This week's poll asks what you think of the most recent Statistics Canada model-based production estimates. You can weigh in with your thoughts on this topic on the poll, found on the lower-right side of your DTN Home Page. We thank you for your input
Cliff Jamieson can be reached at cliff.jamieson@dtn.com
Follow him on Twitter @Cliff Jamieson
© (c) Copyright 2020 DTN, LLC. All rights reserved.


Comments
To comment, please Log In or Join our Community .