Canada Markets
Will November Canola Return to Test Recent Highs?
Canola may be down from recent highs, but far from out, showing counter-seasonal strength early this week in advance of harvest.
While soybean oil, palm oil, rapeseed and canola futures all closed higher on Aug. 18, only rapeseed and canola futures were able to reach fresh highs in their short-term uptrend.
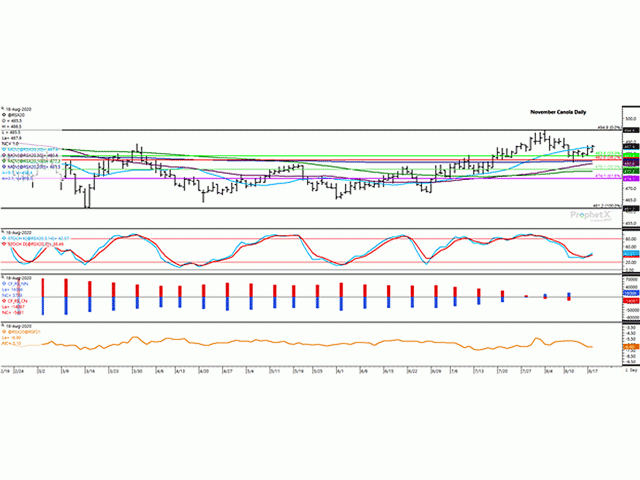
After testing support of the November contract's 200-day moving average and the 38.2% retracement of the move from the contract's March low to August high on Aug. 12, the November contract has closed higher in three of the past four sessions, with the Aug. 18 close up $1/metric ton to $487.80/mt.
Aug. 18 marks the contract's first close above the contract's 20-day moving average in six sessions, while today's close was only $0.10/mt below the midpoint of the $13.80/mt range traded over the past four weeks. After five consecutive higher closes on the weekly chart (not shown), the Nov. contract settled lower for two consecutive weeks, while is up $3.10/mt so far this week.
P[L1] D[0x0] M[300x250] OOP[F] ADUNIT[] T[]
The bars on the second study shows commercial traders growing their bearish net-short position over the past week (red bars) while noncommercial traders added to their bullish net-long position (blue bars) as seen in CFTC data as of Aug. 11. At the same time, these positions remain modest in comparison to the positions reported since the canola data started in August 2018 as both sides show caution.
The lower-study shows the Nov/Jan spread closing at minus $6.90/mt, a modest recovery from the minus $7/mt reported on Aug. 17, which signals a neutral view of fundamentals overall. One year ago, this spread was reported at minus $7.60/mt, after winding up a disappointing 2018-19 crop year that led to a record carryout of 3.8 million metric tons. A drop to an estimated 2 mmt carryout at the end of 2019-20 would be a record year-over-year drop in stocks on a year with sharply reduced Chinese demand.
Should 2019-20 stocks fall closer to 2 mmt and 2020 production reach 20 mmt, it is possible to build a case for stocks to remain unchanged at the end of 2020-21 with 10 mmt available to meet export and domestic demand. Any surprises in early harvest data, the Aug. 31 Statistics Canada production estimates, the Sept. 4 stocks estimates as of July 31 and the Sept. 14 model-based production estimates could result in a test of the current four week range, which ranges from a low of $481.10 to a high of $494.90/mt.
**
DTN 360 Poll
This week's poll asks if you are concerned about the risks and impacts of COVID-19 as we move closer to harvest? You can weigh in with your thoughts on this poll, which is found on the lower-right side of your DTN Home Page.
Cliff Jamieson can be reached at cliff.jamieson@dtn.com
Follow Cliff Jamieson on Twitter @Cliff Jamieson
© (c) Copyright 2020 DTN, LLC. All rights reserved.


Comments
To comment, please Log In or Join our Community .