Canada Markets
A Look at Canola/Spring Wheat Historical Fall Price Corrections
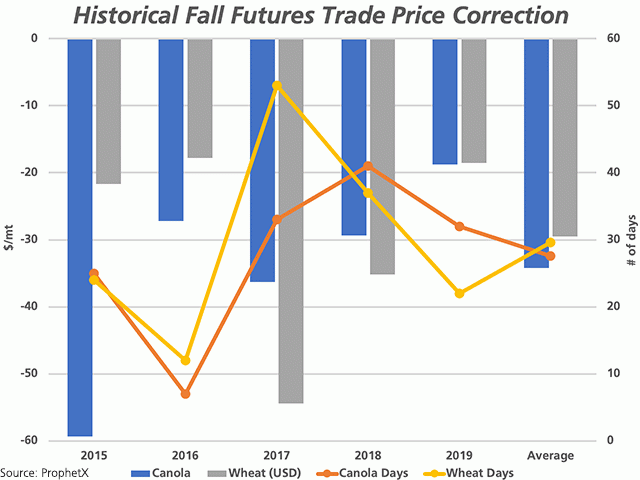
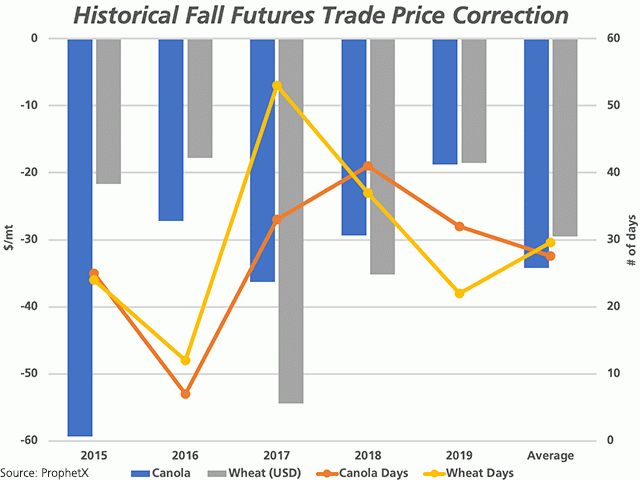
Ahead of widespread harvest activity in North America and the prospect of seasonal lows for both spring wheat and canola, we look at the price change seen for each commodity over the August-September period over the past five years, while calculating an average for this period.
As seen on the attached chart, the Nov canola contract has fallen from $18.80 per metric tons (mt) in 2019 to as much as $59.30/mt in 2015 from the high reached in August to the low reached in the following weeks. The last bar points to an average drop of $34.20/mt over the five years. In 2016, this low was reached on Aug. 31, while the other four years saw this low reached in the month of September and as late as Sept. 18. In all years except for 2018, this fall low reflects the lowest level traded over the balance of the contract.
P[L1] D[0x0] M[300x250] OOP[F] ADUNIT[] T[]
The brown line with markers represents the number of days each year between the August high and the following low. This ranged from as little as seven days in 2016, when the high was reached on Aug. 24 and the low was reached on Aug. 31, to as many as 41 days in 2018, with a high reached on Aug. 8 and a low reached the next month on Sept. 18. The average over the five years was 28 days from the high to the low, which would signal a possible low around Sept. 1 this fall, based on the high reached on Aug. 4. Based on the five-year average, this low would fall to $460.70/mt, or $34.20/mt below the recent $494.90/mt high. This would suggest a breach of all major moving averages and retracement levels.
The grey bars represent the price correction realized from August to September for the MGEX Dec spring wheat contract over the past five years. Calculated in U.S. dollars/mt, this price correction ranged from $17.82/mt USD in 2016 to $54.38/mt USD in 2017. The average correction is $29.52/mt over the five years. This low ranged from Aug. 31 in 2016 to Oct. 2 in 2017.
The yellow line with markers represents the number of days from the August high to the September low, ranging from 12 days in 2016 to 53 days in 2017, while averaging 30 days over the five years. So far, the Dec contract high reached in the month of August was seen on Aug. 3, which would suggest a possible high around Sept. 2. Based on the five-year average, this low would be in the vicinity of $4.95 per bushel on the Dec chart.
Cliff Jamieson can be reached at cliff.jamieson@dtn.com
Follow him on Twitter @Cliff Jamieson
© (c) Copyright 2020 DTN, LLC. All rights reserved.


Comments
To comment, please Log In or Join our Community .