Canada Markets
AAFC's Grain Stocks Forecast Versus Historical
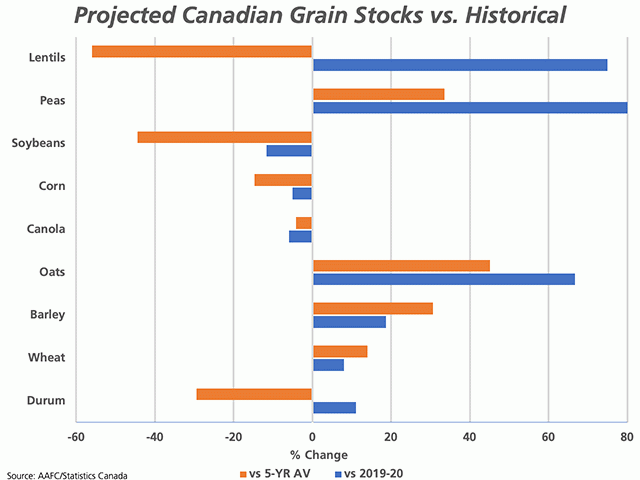
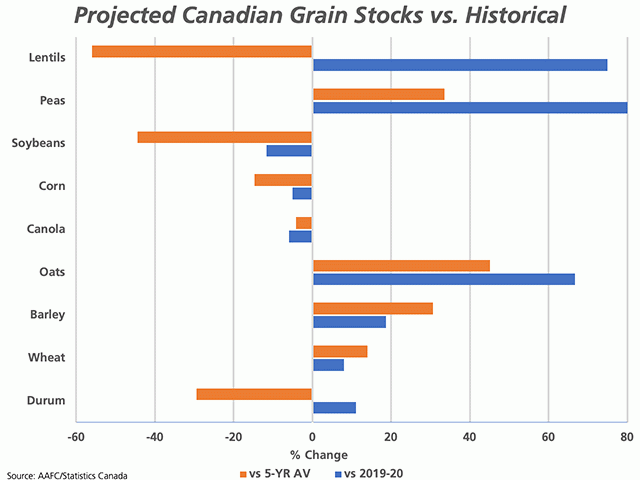
Agriculture and Agri-Food Canada's July Canada: Outlook for Principal Field Crops report allowed supply and demand tables to be updated using Statistics Canada's recent seeded acre estimates, along with other tweaking of fundamentals for 2019-20 and 2020-21. The attached chart shows the expected year-over-year change in ending stocks, keeping in mind that it is early days and there will be a number of factors affecting both the supply side and the demand side of the ledger over the months to come.
Of the select crops, stocks of lentils, peas, oats, barley, wheat and durum are forecast to rise year-over-year. This ranges from a 6% increase in wheat stocks year-over-year to 5.4 million metric tons, to an 80% increase in dry pea stocks to 450,000 metric tons.
In some cases, the chart may appear deceiving. A good example is the forecast year-over-year increase in lentil stocks from 100,000 mt in 2019-20 to 175,000 mt in 2020-21. If realized, this can still be viewed as tight stocks, while the brown bar shows this to be 56% below the five-year average (2015-16 through 2019-20), utilizing AAFC's forecast for 2019-20 along with Statistics Canada's official inventory estimates for the previous years.
P[L1] D[0x0] M[300x250] OOP[F] ADUNIT[] T[]
Another point to be made is that the first number where confidence is required is the ending stocks for 2019-20, with just days left in the crop year for all Canadian crops other than corn and soybeans. What jumps out to me is durum ending stocks, with AAFC leaving this estimate at 900,000 mt for this crop year in the July report. The current estimate for exports is shown at 5 mmt, while cumulative exports as of week 49 is shown at 4.852 mmt. Less than 50,000 mt of licensed exports are needed to be reported each week in the final three weeks of the crop year to reach this forecast, while the most recent week 49 data reported 120,800 mt shipped. Exports appear poised to surpass the target, resulting in even tighter stocks.
The same argument can be made for canola, with AAFC leaving its July export forecast at 9.6 mmt for the 2019-20 crop year, while 9.4775 mmt was shipped through licensed terminals as of week 49. Only 122,500 mt is needed over the final three weeks of the crop year to reach this forecast, or 40,833 mt/week, well-below the 187,800 mt reported as shipped in the most recent week 49 report.
As seen on the chart, stocks are expected to fall year-over-year for corn (5%), canola (6%) and soybeans (12%), with the year-over-year change in brackets. All three of these crops are also forecast to see stocks in 2020-21 fall below their respective five-year average. Soybean stocks of 265,000 mt at the end of 2020-21 are forecast to be 44.5% below the five-year average and would be the lowest in six years.
**
DTN 360 Poll
This week's poll asks how you view the rainfall that has hit your region to-date. Is it enough? Too much? You can weigh in with your thoughts on this week's poll, found on the lower-right side of your DTN Canada Home Page. We thank you for sharing your view.
Cliff Jamieson can be reached at cliff.jamieson@dtn.com
Follow him on Twitter @Cliff Jamieson
© (c) Copyright 2020 DTN, LLC. All rights reserved.


Comments
To comment, please Log In or Join our Community .