Canada Markets
Strengthening Prairie Basis Buoys CWRS Bids
July MGEX spring wheat futures closed lower for a third straight week, having lost 24 1/2 cents in the week of April 13, 6 1/4 cents for the week of April 20 and 6 1/2 cents lower for the week of April 27. A fresh contract low was reached of $5.04/bushel and is coming close to a test of nearby support on the continuous chart at $5/bu.
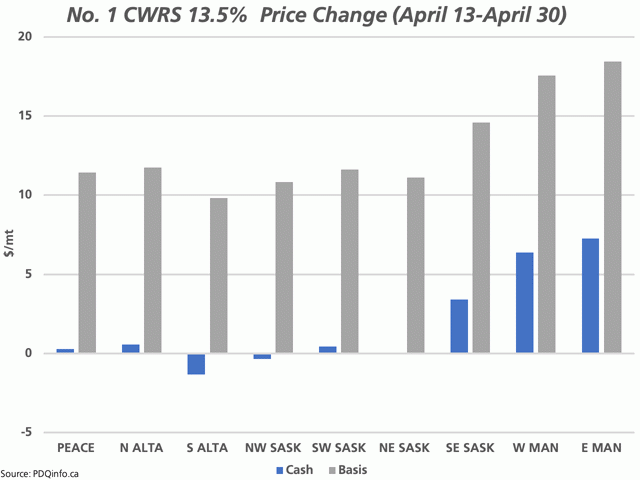
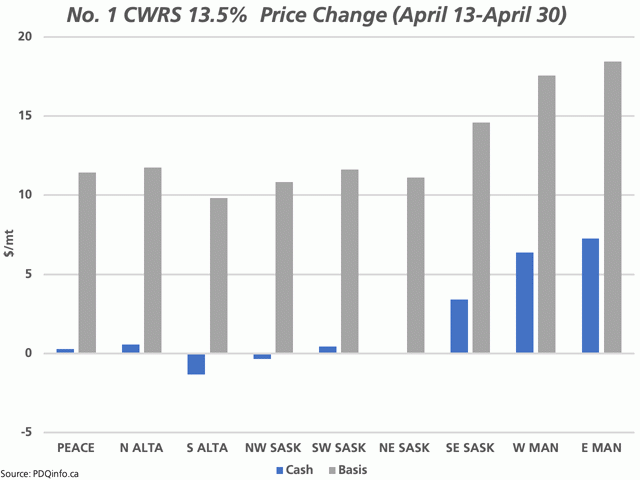
Over this period (April 13 to April 30), prairie No. 1 CWRS bids showed resilience, with pdqinfo.ca data showing Canadian dollar producer bids increasing over the past three weeks in seven of the nine regions reported, as shown on the blue bars on the attached chart.
While this bid weakened $1.33/metric ton in southern Alberta and $0.04/mt in northeast Saskatchewan, it rose from $0.28/mt in the Peace River region of Alberta to a high of $7.27/mt in eastern Manitoba. The average across the nine regions shows an increase of $1.85/mt.
While Canadian dollar weakness played a role, the exchange with the United States dollar weakened only 25.5 basis points from April 13 to April 30.
P[L1] D[0x0] M[300x250] OOP[F] ADUNIT[] T[]
It's interesting to note the price hike seen in the eastern Prairies showing the largest jump, with the southeastern Saskatchewan bid up $3.42/mt, the western Manitoba bid up $6.39/mt and the eastern Manitoba bid up $7.27/mt.
The Canadian Grain Commission reported 509,100 mt of wheat delivered into the licensed handling system in week 38, or the week ending April 26, down from the previous week but still 47.9% higher than the five-year average for this week, while during a busy time of year.
Cumulative deliveries of wheat as of week 38 are reported at 15.9491 million metric tons, just marginally lower than the same 38 week period in 2018-19 while 11.7% higher than the five-year average.
Given the interest in spring wheat in the eastern Prairies, one could potentially look for increased movement into U.S. mills in future data releases. The Ag Transport Coalition's Daily Loads on Wheels by Pipeline Location for April 30 shows 1,828 hopper cars in the Thunder Bay pipeline, down 26% from the 10-day moving average. At the same time, the number of cars in the U.S./Mexico pipeline are reported at 755 hopper cars, up 16% from the 10-day average.
**
DTN 360 Poll
This week's poll asks what you think of the move to delay the release of ag reports by Statistics Canada as shown in its revised schedule due to COVID-19. You can weigh in with your thoughts on this poll on your Canadian site Home Page.
Cliff Jamieson can be reached at cliff.jamieson@dtn.com
Follow him on Twitter @Cliff Jamieson
© (c) Copyright 2020 DTN, LLC. All rights reserved.


Comments
To comment, please Log In or Join our Community .