

Ag Weather Forum
This El Nino-to-La Nina Spring is Drier Compared With Analog Years
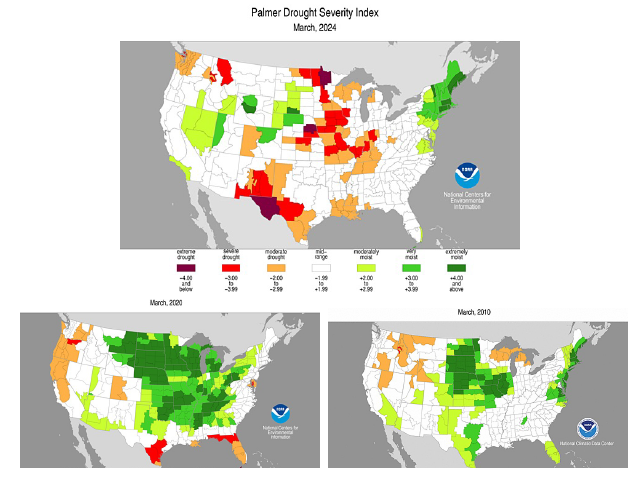
For almost 60 years, the Palmer Drought Severity Index (PDSI) has been a standard tool to analyze drought and soil moisture conditions. The PDSI was developed by meteorologist Wayne Palmer, who first published his method in the 1965 paper "Meteorological Drought" for the Office of Climatology of the U.S. Weather Bureau. The PDSI uses temperature and rainfall information in a formula to determine dryness. A commentary by the National Centers for Atmospheric Research noted that "the Palmer Drought Severity Index (PDSI) is the most prominent index of meteorological drought used in the United States for drought monitoring and research ..."
A look at the PDSI map for March 2024 shows drought conditions as "moderate" to "severe" in much of the western and southern Midwest. Parts of the Central Plains are listed as in "extreme" drought. Meanwhile, portions of the north-central Plains are listed as being in "moderately moist" to "extremely moist" conditions. That is much different than the years 2010 and 2020, when the March PDSI maps showed almost the entire central U.S. from the Plains to the Midwest in "very moist" to "extremely moist" conditions. Soil profiles were full.
P[L1] D[0x0] M[300x250] OOP[F] ADUNIT[] T[]
Now, to concern about moisture prospects for this crop year. The Pacific Ocean El Nino-Southern Oscillation (ENSO) temperature and barometric pressure feature is widely forecast to change from the warm-ocean El Nino to the cool-ocean La Nina during the Northern Hemisphere summer, possibly as early as June. When that has happened in the past, DTN's long-range forecast team has identified the years 2010 and 2020 as the top two analog years for reference in developing forecasts and risk assessments.
U.S. corn production in those top two analog years of 2010 and 2020 were both 7% below initial estimates because of late-season heat and dryness impact on filling corn. However, crops in both years benefited from a well-supplied soil moisture profile at the beginning of the season. The PDSI March 2024 rendition suggests that crops will already lack a full helping of moisture to work with as planting continues.
This dry start also looms as a season-long feature due to active crop and plant root systems using up available moisture as well as warm season evapotranspiration.
Bryce Anderson can be reached at Bryce.Anderson@dtn.com
(c) Copyright 2024 DTN, LLC. All rights reserved.

Comments
To comment, please Log In or Join our Community .