

Technically Speaking
Monthly Analysis: Livestock Markets
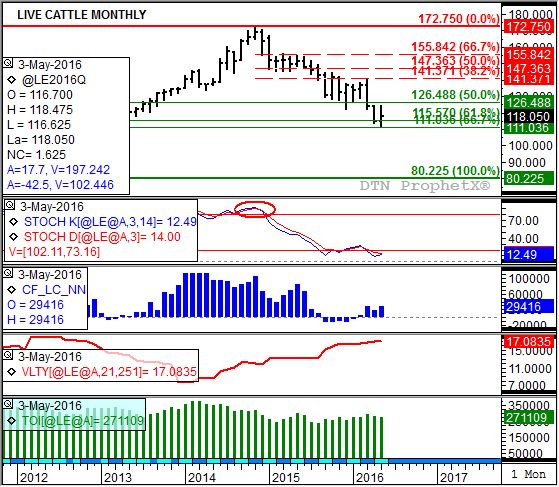
Live Cattle: The August contract closed at $118.05, up $3.125 on the monthly chart. Live cattle are an interesting technical study. Had the June remained the most active contract, its close of $121.00 would have established a bullish key reversal on the monthly chart and most likely created a corresponding bullish crossover by stochastics. Yet the August took over the role of most active and came up mere ticks shy of a bullish key reversal. Still, support at $111.025, a price that marks the 67% retracement level of the previous uptrend from $80.225 (March 2009) through the high of $172.75 (November 2014), seems to have held. This sets the stage for a potential bullish crossover in June.
P[L1] D[0x0] M[300x250] OOP[F] ADUNIT[] T[]
Feeder Cattle: The August contract closed at $147.10, up $6.725 on the monthly chart. The market continues is indicating its Wave C low (Elliott) was established in April. This low ($138.10) was a test of support near $183.825, a price that marks the 67% retracement level of the previous uptrend from $85.45 (December 2008) through the high of $245.75 (October 2014).
Lean Hogs: The August contract closed at $81.45, down $0.25 on the monthly chart. The market remains in a major (long-term) uptrend, closing above resistance near $78.775 but below next resistance at $82.75. These prices mark the 33% and 38.2% retracement levels respectively of the previous downtrend from $132.825 (June 2014) through the low of $51.80 (November 2015). Monthly stochastics are nearing the overbought level of 80% giving the market an outside chance of a 50% retracement up to near $92.30.
Corn (Cash): The DTN National Corn Index (NCI.X, national average cash price) closed at $3.69 1/4, up 12 3/4 cents for the month. The NSI.X broke out of its major (long-term) sideways trend in May and now looks to be trending up with resistance at the high from October 2015 near $3.64 1/4. The next upside target is $4.05 3/4, a test of both the July 2015 high and $4.10, the 23.6% retracement level of the previous major downtrend from near $8.26 1/4 (August 2012) through the October 2014 low near $2.81 1/4.
Soybean meal: The July contract closed at $396.60, up $61.80 on the continuous monthly chart. The major (long-term) trend remains up with the July contract closing near resistance at $400.30. This price marks the 50% retracement level of the previous downtrend from $541.80 (September 2012) through the low of $258.90 (February 2016). Given the bullish monthly stochastics, reflecting increased buying interest from noncommercial traders, and a bullish forward curve the market could extend its rally to the 67% retracement level of $447.60.
To track my thoughts on the markets throughout the day, follow me on Twitter: www.twitter.com\DarinNewsom


Comments
To comment, please Log In or Join our Community .