
Technically Speaking
Another Round of Bearish Signals for USDX
Stop me if you've heard this one before: Based on my analysis of its weekly chart the U.S. dollar index (USDX) looks to be in a secondary (intermediate-term) downtrend. I'll wait a moment for the laughter to die down.
Yes, I know the January jobs data (nonfarm payrolls, unemployment rate) is scheduled for release this coming Friday (February 5), and this could very well light a fire underneath the U.S. dollar. And yes I'm well aware of the normality of foreign central banks moving to negative interest rates, weakening domestic currencies and driving global investment buyers to the greenback.
But the USDX weekly chart is what it is; and what it is is bearish (a tip of the cap to Andy Griffith's famous "What it Was Was Football" bit ahead of this weekend's big game).
P[L1] D[0x0] M[300x250] OOP[F] ADUNIT[] T[]
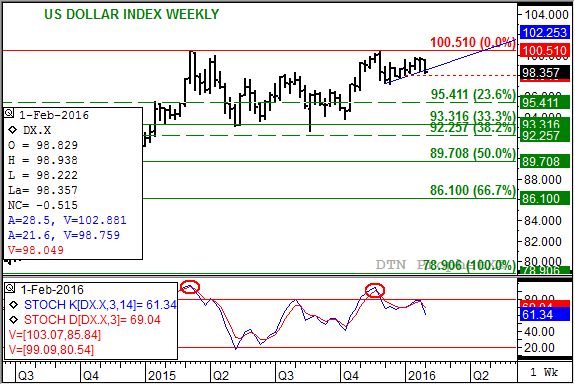
Let's take this apart piece by piece. First, go back to the left-cent of the top chart and note the high of 100.390 the week of March 9, 2015. If you drop down to the weekly stochastics (momentum study, bottom chart) you'll see that the sell-off the following week established a bearish crossover (faster moving blue line crossed below the slower moving red line) above the overbought level of 80%. This was the initial signal that the secondary trend was in a period of change.
From there the USDX tested support between 93.316 and 92.257, the 33% and 38.2% retracement levels of the previous uptrend from 78.906 through the 100.390 high. However, an autumn rally saw the USDX post a new high of 100.510 the week of November 30.
Take a close look at the action that week (Nov 30) though. Notice that the USDX posted its new high, then fell well below the previous week's low of 99.312 before closing lower for the week. This is a clear bearish reversal that coincided with a confirming bearish crossover by weekly stochastics below the levels of the first the previous March. From a technical point of view this is as clear a case of a market moving into a downtrend as there could be.
But the USDX isn't an ordinary market, at least not these days. Rather than collapsing it immediately went into a consolidation phase marked by gradually higher lows (top chart, blue line). Until this week, that is. Thee USDX has not only fallen below consolidation trendline support, but is challenging the 4-week low 98.049 (dashed red line) as well. Moving to new 4-week lows (or highs) is another important indicator that the trend, and momentum, of a market has changed. In this case it would be down.
How far the USDX might fall is a matter of simple math. Find the bearish breakout point from the week of its bearish reversal (in this case the previous week's low of 99.312) and find the range to the low before consolidation began (97.190). This gives a range of 2.122 that is then subtracted from the bearish breakout point of the consolidation phase (98.759). This time around that formula puts the downside target at approximately 96.637, still above initial technical support at the 23.6% retracement level of 95.411.
Now let's consider the major (long-term) trend also looks to be down based on trade patterns and monthly stochastics. If the USDX extends its secondary downtrend beyond the targeted 96.637 level and moves beyond support near 93.316, then the major downtrend could ultimately test support near 85.600. This level marks a 50% retracement of the previous major uptrend from 70.698 (March 2008 low) through the December 2015 high of 100.510.
To track my thoughts on the markets throughout the day, follow me on Twitter:www.twitter.com\Darin Newsom

Comments
To comment, please Log In or Join our Community .