

Technically Speaking
Wheat Like the Phoenix

In Friday's (October 25) On the Market column, I talk about how the fund-led rally of 2008 led to the wheat complex crashing to the ground, leaving both the futures and cash markets a smoldering pile of ashes. Since then, wheat has tried to regain some of its strength, only to be trampled back down as investment traders focused on corn. Now though, as corn's reign appears to be coming to an end, the monthly chart for Chicago wheat is indicating the market could be set to rise again.
To me the monthly wheat chart is fascinating. It illustrates the most basic aspects of technical analysis, providing a sound argument for those who argue that in this day and age of computer algorithms, charts still matter.
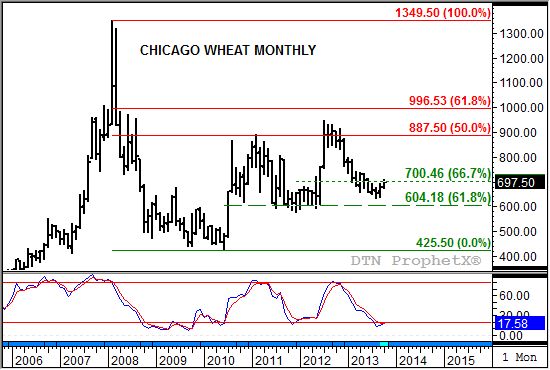
Let's go back in time, as charts allow us to do. If February 2008 the nearby contract (then the March 2008 contract) posted a ridiculous high of $13.49 1/2 as unchecked noncommercial buying interest flew in the face of an increasingly bearish commercial outlook. And as the divergence between the two sides (commercial and noncommercial) inevitably led to a collapse, monthly stochastics established a bearish crossover indicating the market was set for a substantial turn lower.
And turn lower it did. By October 2009 the nearby contract had fallen to a low of $4.39 1/4 before posting just enough of a rally to allow stochastics to create a bullish crossover well below the oversold level of 20%. However, since the cash market was still in shambles, the best the market could do was climb to $5.98 (December 2009) before falling back to a new low of $4.25 1/2 (June 2010). Note though that this was a spike low, characteristic of wheat, before the nearby contract closed higher for the month.
Going back to the bullish crossover by monthly stochastics at the end of October 2010, the market had "technically" reestablished a major (long-term) uptrend. It just took a while, roughly nine months (November 2009 through July 2010) to take off. That initial bullish turn though resulted in a move that took the nearby contract to a peak of $8.93 1/4, a test of the 50% retracement level of the previous downtrend. Note that monthly stochastics did not establish a bearish crossover above the 80% level, but rather below it, a situation that would be repeated on the next leg up through July 2012. Therefore, the 2009 uptrend has not officially come to an end.
Given that, the sell-off from the February 2011 peak through the low posted in July of that same year, and the subsequent consolidation through June 2012, amounted to nothing more than a 67% retracement (near $5.81 1/4) of the initial leg of the long-term uptrend. The second leg was the previously mentioned move to the July 2012 high of $9.47 1/4. Again the market fell, this time to just below support near $7.00 1/2 as it posted a low of $6.35 1/2 in August 2013.
However, the market again stabilized with monthly stochastics showing another possible bullish crossover below 20% this month. All this combined indicates Chicago wheat is set to embark on the third leg of its major uptrend with a price objective just short of $10. The 61.8% retracement of the 2008 downtrend is calculated near $9.96 1/2, sitting just above a series of highs the market posted between April 2008 and August 2008. If the Chicago wheat market does approaches this price target, it will likely result in monthly stochastics moving above the 80% level, setting the stage for the establishment of a possible long-term downtrend.
P[L1] D[0x0] M[300x250] OOP[F] ADUNIT[] T[]
To track my thoughts on the markets throughout the day, follow me on Twitter: www.twitter.com\Darin Newsom
Commodity trading is very complicated and the risk of loss is substantial. The author does not engage in any commodity trading activity for his own account or for others. The information provided is general, and is NOT a substitute for your own independent business judgment or the advice of a registered Commodity Trading Adviser.
Comments
To comment, please Log In or Join our Community .