

Fundamentally Speaking
Seasonality of December Corn Futures
End-users of corn certainly have to be pleased with the early prognosis of the 2014 U.S. crop as veteran crop scouts, albeit early, see this is one of the best developing in recent memory.
Even though the USDA has set the bar very high with their initial yield forecasts, coming in at a record 165.3 bushels per acre (bpa), the historically high early season crop ratings suggest this is very doable.
If this is the case then prices should head lower, perhaps significantly, so the question then becomes how low will values sink and when will these lows be established?
P[L1] D[0x0] M[300x250] OOP[F] ADUNIT[] T[]
We will tackle the first question in a later post as that will be dependent on actual production and usage as it relates to the stocks to use ratio.
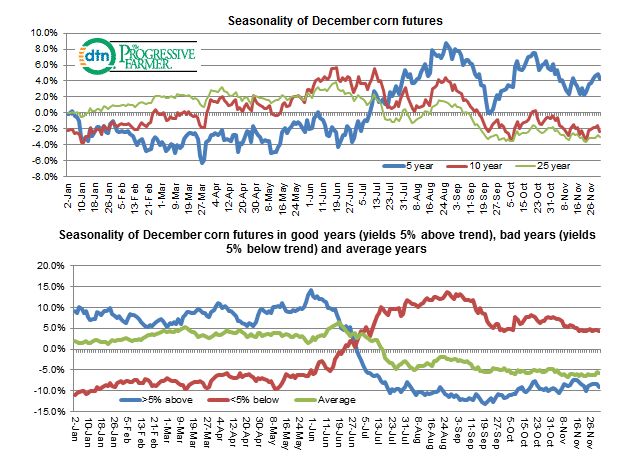
As for when the lowest will be established, the two charts here examine the seasonality of December corn futures, the first new crop month.
The first chart shows the five, ten, and 25 year seasonality and note that the 10 and 25 year lines exhibits the typical seasonal pattern of corn where the season's highs are set right before the beginning of July, just before corn goes through pollination, the most critical part of the growing season.
Assuming that this reproductive phase proceeds normally, which is about 65% of the time, prices usually descend into the fall with the ultimate low seen in early October, often coinciding with the halfway point of harvest.
Notice that the five year trend diverges from the 10 and 25 with the lows occurring in early April and reaching their peak by late August-early September.
The reason for this was the year's 2010 to 2012 were not good growing seasons with each year worse than the last culminating in a 123.4 bpa yield in 2012, 24% below trend in one of the worst performances in U.S. history.
Given this situation, perhaps a better way to look at seasonality is seen in the other graphic showing seasonal price patterns when yields are good, i.e. 5% or more above trend, average or trend, and bad or 5% or more below trend.
When the market perceives that yields will be favorable which appears to be the case this year, prices usually peak out at the beginning of June and tend to establish the seasonal low towards the middle of September before values rebound into the final quarter of the year.
If the market perceives trend yields then prices drift sideways through the spring and then ease into the fall and early winter with lows above those seen for a good crop.
Finally, if the market feels that a below average crop is in the offing then prices rally from early May and peak out in August before sliding into the fall.
(KA)


Comments
To comment, please Log In or Join our Community .