

Fundamentally Speaking
Corn, Soybean Seeding Trends
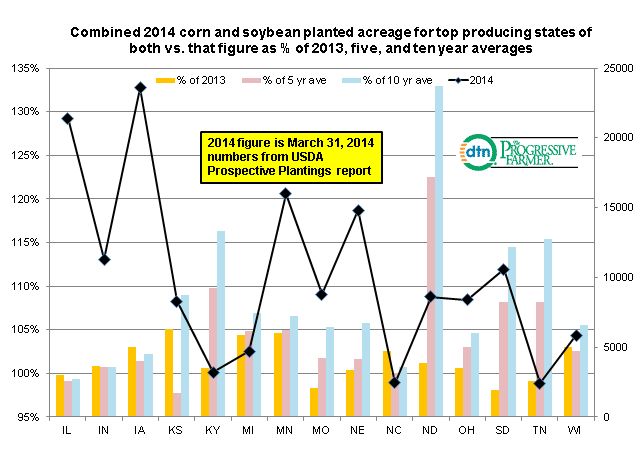
The debate continues about what final 2014 planted acreage could be for the nation’s corn and soybean crop after the release of the Prospective Plantings report.
Interestingly, the USDA increased the intended acreage of the main crops by only 0.6 million acres despite the large amount of ground that was enrolled in the prevented planting program last year and the 2.0 million acres coming out of the Conservation Reserve Program.
P[L1] D[0x0] M[300x250] OOP[F] ADUNIT[] T[]
Expectations are that final planted area will be larger than the 91.7 and 81.5 million acres reported for corn and soybean intentions respectively though Mother Nature will have final say on exactly how much of each crop is put in the ground.
The accompanying graphic shows the combined 2014 corn and soybean planted acreage for the top 15 producing states of both.
That figure as a percent of 2013 final acreage and the percent of the five year and ten year combined acreage is also reported.
Despite the large amount of unplanted acreage last year, a look at the individual states shows a number having combined intended corn and soybean area down from 2013 levels and this includes IL, MO, SD, and TN with a few others just having a marginal increase in combined plantings.
Also of interest and something we have talked about in prior posts is the expansion of corn and soybean plantings in states outside the traditional producing regions.
The chart shows that this year’s combined corn and soybean planted area continue to climb relative to past years in such states as KY, ND, SD, and TN.
We surmise that improved per acre profitability for corn and soybeans exceeds those of other crops that in the past were seeded in these states such as spring and durum wheat in the Dakotas and cotton in the Delta states of TN and KY.
(KA)

Comments
To comment, please Log In or Join our Community .