

Todd's Take
A Tale of Two Wheats, 10 Years Apart
If there is one market that is going to drive me crazy, it's wheat. Wheat has long been known for its ability to frustrate traders and you've probably heard the expression, "Trade in wheat, sleep in the street."
If you've read recent market comments or "Todd's Takes" on wheat, such as the Jan. 20 column, "Commercial Grain Firms Find Value in Wheat's Cheap Price," at https://www.dtnpf.com/…, you know that I've pointed out several market clues that suggest wheat prices are undervalued. Historically speaking, when noncommercials turn net short and commercials turn net long, especially when wheat prices are fundamentally cheap as they are today, it's normally a matter of time before commercial positions are proved correct and noncommercials go scrambling for cover. So far, this market has behaved differently and, frankly, it's extremely frustrating to try to explain.
I've gone over the situation from many angles, but there is one simple comparison that speaks volumes about how unusual today's situation is. Just as our meteorology team uses analog years to build expectations into its forecasts, we can also use analog years to give us an idea of what prices to expect. It's not a perfect method, but it does shed some light.
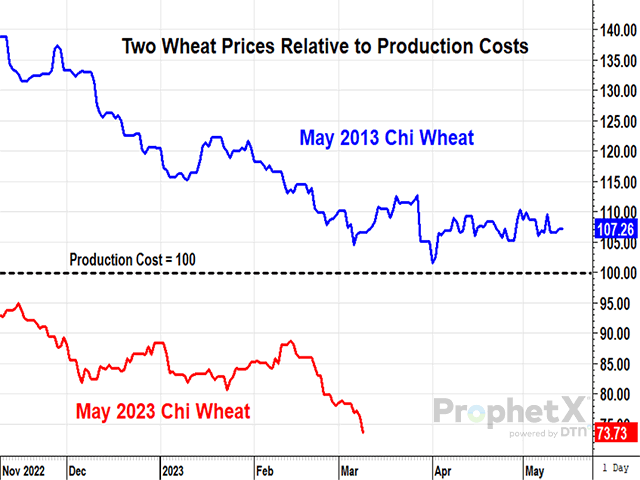
On Wednesday, March 8, USDA left its estimate of U.S. ending wheat stocks at 568 million bushels (mb) or 29.9% of annual use. Looking at previous years, we can see the 2012-13 season also had an ending stocks-to-use ratio of 29.9%. On March 8, 2013, May Chicago wheat ended at $6.97 a bushel. On March 9, 2023, May Chicago wheat ended at $6.53 1/2 a bushel.
P[L1] D[0x0] M[300x250] OOP[F] ADUNIT[] T[]
Those two prices look pretty close to each other, but wait, we haven't factored in inflation yet; $6.97 in 2013 is the equivalent of $8.89 per bushel today. Better yet, I prefer comparing prices to their cost of production. In 2013, $6.97 per bushel for May Chicago wheat was 6.6% above USDA's estimated cost of production for the 2012 wheat crop. The equivalent price in today's market would be $9.62 per bushel, over $3.00 a bushel higher than Thursday's (March 10, 2023) May close of $6.53 1/2. Instead of being 6% above USDA's estimated cost of production, Thursday's close is 28% under USDA's $9.03 per bushel cost estimate.
It is interesting that the two years also had a similar world supply situation. World wheat stocks, excluding China totaled 22% of annual use in 2012-13, while the same metric is 20% in 2022-23. The ending stocks-to-use ratio of the season that followed 2012-13 dropped to 24%. We don't yet know what next season will bring for U.S. wheat supplies, but USDA's early estimate at the Ag Outlook Forum in February guessed a slightly higher ending stocks-to-use ratio of 31%.
In terms of outside market factors, 2013 was much different than today. One-year T-bills were barely above zero in 2013 and yielded 5.18% Thursday. There are a lot more dollars floating around these days as nominal GDP is up 57% from what it was in 2013. A big obvious difference, of course, is Russia's war on Ukraine. I could understand a $3.00 war premium in 2023, but a $3.00 war discount? A painful difference I cringe to mention is that, in 2013, the U.S. was the largest exporter of wheat in the world. In 2022-23, Russia is the undisputed leader of wheat exports while the U.S. has fallen to No. 5 on the list.
After considering the differences, I find it difficult to say any of the external factors justify a $3.00 difference between the two prices, representing equivalent supply situations relative to demand 10 years apart.
You probably won't be surprised to hear that, among the big three crops over the past 23 years, wheat prices have the least correlation to their supply situations, which is like saying gravity doesn't work for some people. As an analyst, that is the factor that has bothered and hurt me most.
It pains me to say I don't have a better explanation of why wheat prices are this low when they clearly seem to deserve better. It is crazy to me that funds have written the equivalent of 308 mb of IOUs of soft red winter wheat and I'm the one headed to the looney bin. For the present moment, that is exactly what is happening.
**
Comments above are for educational purposes only and are not meant as specific trade recommendations. The buying and selling of grain or grain futures or options involve substantial risk and are not suitable for everyone.
Todd Hultman can be reached at todd.hultman@dtn.com
Follow Todd Hultman on Twitter @ToddHultman1
(c) Copyright 2023 DTN, LLC. All rights reserved.