

Technically Speaking
Soybean Long-Term Monthly Chart
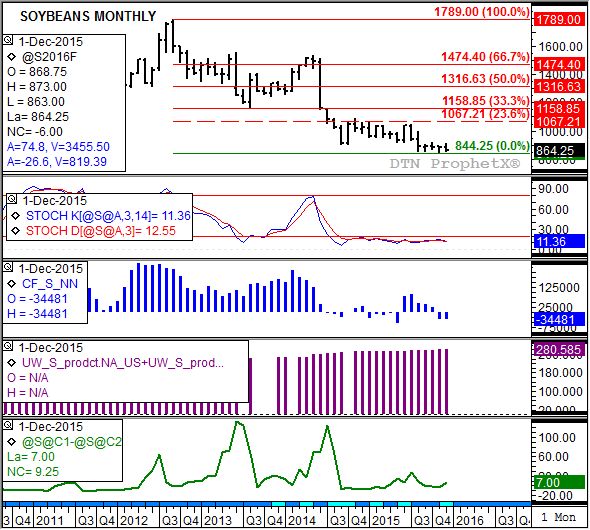
Looking back, the soybean market went over the edge of the falls back in September 2012. From its peak of $17.89 it quickly fell to a low of $13.41 (April 2013), bobbed back to a high $15.58 3/4 that June, before falling again to the next level $11.62 1/2 during August. After stabilizing, and floating back to $15.36 3/4 May 2014), the ground below eroded away again taking the market all the way down to $9.04 by that October.
From there the market bounced along, cresting as high $10.86 1/4 before breaking through its support this past August on its way to a new low of $8.44 1/4 in November. Now that the end of the year has come and gone, with the more active March contract closing at $8.64 1/4, the question is whether or not the market has reached rock bottom or if the ground is eroding below its feet as we speak.
P[L1] D[0x0] M[300x250] OOP[F] ADUNIT[] T[]
Monthly stochastics don't tell us much, holding its breath below the oversold level of 20% since September 2014.
Most of the pressure over the last three years has come from noncommercial (investment) selling. Analysis of weekly CFTC Commitments of Traders numbers shows this group held a net-long futures position of 249,342 contracts at the end of April 2012. By the end of May 2015 this position had been flipped to a net-short of 54,954 contracts. The rains in the U.S. this past spring sparked a round of noncommercial buying, enough to rebuild a net-long position of 91,971 contracts by the end of July. But it didn't last, falling to a net-short of 34,481 contracts late this past December.
I studied a number of different World Agricultural Supply and Demand Estimate (WASDE) statistics, looking for the strongest correlation with noncommercial activity. I settled on the combined production of the United States and South America. Back in July this number climbed to 275.5 mmt from June's 273.9 MMT. Since then the number has steadily increased, reaching a peak of 280.6 mmt in November, a figure that was maintained in December. Though correlation doesn't prove causation, it seems logical that noncommercial buying interest isn't coming back until these production numbers start to come down again. And given the weather issues faced by Mato Grosso this winter, it's possible a decrease could be seen in the January round of reports.
The market's view of fundamentals continues to disagree with monthly WASDE numbers. December saw the January contract (in delivery) move to a 7-cent inverse over the March issue. Recall that when evaluating spreads, an inverse price relationship (nearby contract higher priced than the next deferred) reflects a bullish short-term supply and demand situation. It should also be mentioned that the March to May spread ended the year showing a 5 1/4 cent carry, covering only 36% (a neutral-to-bullish level) of full cost of carry (total storage and interest costs of holding the cash commodity in a commercial facility). Keep a close eye on both the March-to-May and May-to-July (7 1/4 cents, 48%) spreads as more becomes known about Brazil's crop.
So, where to from here? As mentioned above it all depends on the flow of noncommercial money. Though the market is at its lowest price level since April 2009, this group has shown little interest in buying. But if upcoming WASDE reports start to show smaller production numbers, who knows? It may just be enough to stop this long ride down.
To track my thoughts on the markets throughout the day, follow me on Twitter:www.twitter.com\Darin Newsom

Comments
To comment, please Log In or Join our Community .