

Fundamentally Speaking
What Should the 2013 U.S. Soybean Yield Trend be Estimated At?"

In a prior piece, we discussed what should the 2013 U.S. corn yield be estimated at given the poor performance seen in recent years.
This is also a timely topic in that the USDA Ag Outlook Conference will be held next month when the government will issue its first tentative balance sheets for the 2013-14 season including yield projections.
P[L1] D[0x0] M[300x250] OOP[F] ADUNIT[] T[]
Soybean yields have also been suppressed by adverse growing weather the past three seasons though not to the degree that corn has.
This was especially true last year when better rain distribution in August and September helped contain soybean losses where the final yield of 39.6 bushels per acre was just 9% below trend as opposed to a final 2012 corn 23% below trend.
Corn yields have been down three years in a row, unprecedented in modern history and have resulted in the ten year trend actually declining by 1.4 bushels per year.
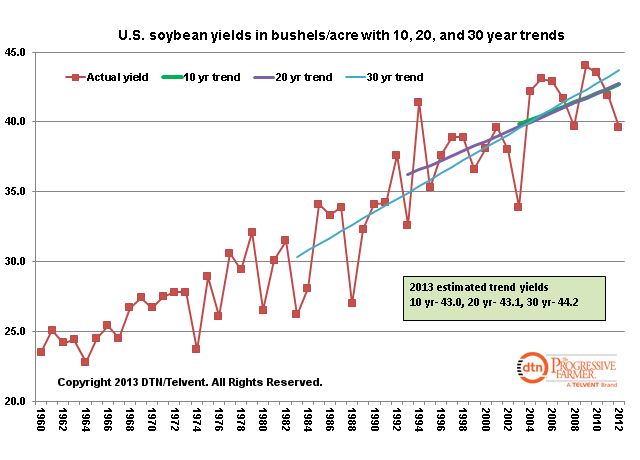
This graphic shows actual U.S. soybean yields in bushels per acre since 1960 along with the 10, 20, and 30 year trend.
All show upward growth but the fact that soybean yields have also declined for three straight years has resulted in the 30 year trend increasing by 0.46 bushels per year, the 20 year by 0.34 bushels, and the ten year by 0.32 bushels.
Consequently, using a 30 year trend the estimated 2013 soybean yield comes out to 44.2 bushels per acre, the 20 year trend results in a 2013 yield of 43.1 bushels per acre, and the ten year the lowest at 43.0 bushels per acre.
A number of 2013-14 soybean balance sheets we have seen are using a tentative 2013 soybean yield of 43.5 bushels per acre that based on these discussions seems very reasonable.
(KA)
Comments
To comment, please Log In or Join our Community .