Canada Markets
Wet Years on the Prairies and Implications for Seeded Acres
This week's crop reports from both Saskatchewan and Manitoba signal the challenges faced by eastern Prairie producers, with Manitoba producers having seeded 4% of intended acres as of May 17, behind the five-year average of 50%. As of May 16, Saskatchewan producers are estimated to have seeded 33% of intended acres, behind the five-year average of 53%.
At the time of writing, the radar is pointing to activity across southeast Saskatchewan and Manitoba, signaling a rain/snow mix. At the same time, DTN's seven-day precipitation map is possibly the most favorable seen for the eastern Prairies in weeks, with a potential disturbance seen for late next week but very low amounts of precipitation expected. At the same time, this forecast fails to include the badly needed moisture required in the western Prairies.
We refer to AAFC's Percent of Average Precipitation maps for the April 1 through May 31 period over recent history, looking for years showing above average Prairie moisture through the weeks that coincide with spring planting.
P[L1] D[0x0] M[300x250] OOP[F] ADUNIT[] T[]
These maps would show the wettest years in recent history include the years from 2010 through 2014, 2016 and 2017. None of the maps for these seven years mirror the current map as of May 16, 2022, which shows above average precipitation for the southeast Prairies as well as the northwest Prairies, or the Peace Region of Alberta.
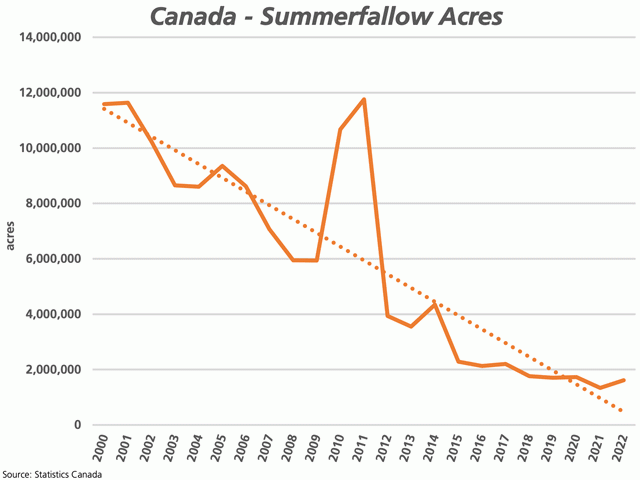
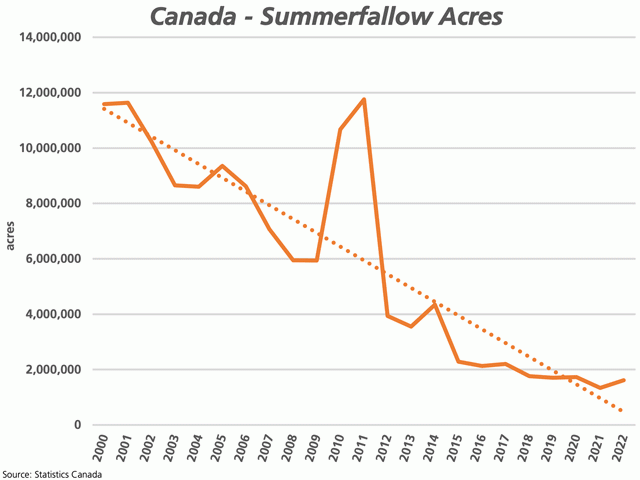
If we compare these seven weeks to Statistics Canada's summerfallow acre estimates, as seen attached, we see that the estimate for summerfallow acres increased year-over-year in four of the seven years in question. What jumps out is a 4.735 million acre or 80% increase in summerfallow acres from 2009 to 2010 to 10.671 million acres, which is 44.5% higher than the five-year average. Summerfallow acres grew by a further 1.092 million acres or 10.2% to 11.763 million acres from 2010 to 2011.
When looking at the change in seeded acres from Statistics Canada's March Intentions data, released in April, to the final acres reported in December, we see that in 2010, spring wheat acres fell by 1.688 million acres from the early intentions to what was actually seeded; durum acres fell by 535,000 acres; barley acres fell by 1.4 million acres; and canola acres rose by 678,700 mt. This year was unique in a sense that April 1 through May 31 precipitation was well above average across the majority of the Prairies, with acreage losses seen across all three provinces.
In 2011, spring wheat acres fell 2.2 million acres from the March Intentions report to the final acres seeded; durum fell by 1.039 million acres; barley by 1.2 million acres; and canola fell by 275,000 acres from the estimates found in the March Intentions report to the final estimates. Once again, the April 1 through May 31 precipitation map was unique, with above average precipitation largely below the No. 1 highway in southern Alberta and Saskatchewan, while including most of Manitoba.
When the other five years in question are considered (2012-2014, 2016, 2017), acres seeded to spring wheat fell from 174,000 acres to 862,700 acres from the March Intentions to the final seeded acre estimate, while dropping by an average of 868,000 acres over the seven years. Canola acres fell from the March intentions to the final estimated acres in only one of the seven years, while increasing by an average of 955,000 acres from the March Intentions report to the final seeded acres.
Cliff Jamieson can be reached at cliff.jamieson@dtn.com
Follow him on Twitter @Cliff Jamieson
(c) Copyright 2022 DTN, LLC. All rights reserved.


Comments
To comment, please Log In or Join our Community .