

Technically Speaking
Monthly Analysis: Grain Markets
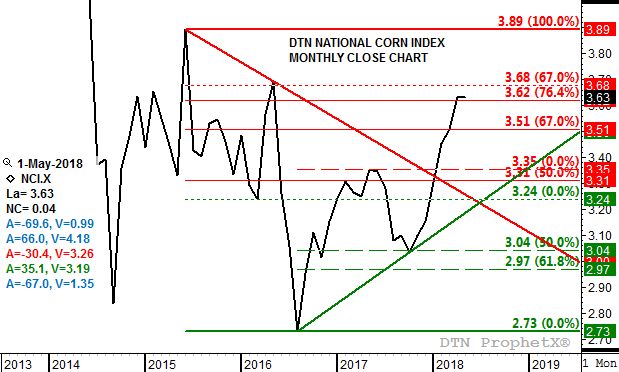
Corn (Cash): The DTN National Corn Index (NCI, national average cash price) closed at $3.63, up 13 cents for the month. The NCI is in a major (long-term) uptrend, with the ongoing rally looking to be Wave 3 of a 5-wave pattern. The April settlement of $3.63 is a test of resistance at $3.62, a price that marks the 76.4% retracement level of the previous downtrend from $3.89 through the low of $2.73. Seasonally the NCI could be nearing a top, and if so, the next sell-off would be viewed as Wave 4.
Corn (Futures): The July contract closed at $4.00 3/4, up 13 cents on the monthly chart. The major (long-term) trend on the market's monthly close-only chart is sideways-to-up. The July contract was challenging resistance at $4.04 3/4, the close from May 2016. Next resistance is at $4.22 from June 2015.
P[L1] D[0x0] M[300x250] OOP[F] ADUNIT[] T[]
Soybeans (Cash): The DTN National Soybean Index (NSI, national average cash price) closed at $9.72, up 4 cents for the month. The NSI remains trendless long-term. Initial resistance on the monthly close-only chart is at February's settlement of $9.76. Initial support is at the March close of $9.67.
Soybeans (Futures): The July contract closed at $10.48 1/2, 3 3/4 cents on the monthly chart. The major (long-term) trend for soybean futures remains sideways-to-up, with April showing the third consecutive monthly close above the previous high of $10.35 3/4 (February 2017). Beyond that resistance is at $11.53 1/4, the monthly close for June 2016.
HRW Wheat (Cash): The DTN National HRW Wheat Index (HW.X, national average cash price) closed at $4.84, up 58 cents for the month. The major (long-term) trend on cash HRW wheat's monthly close-only chart is up. However, monthly stochastics are nearing the overbought level of 80%, possibly limiting upside potential.
HRW Wheat (Futures): The July Chicago (SRW) contract closed at $5.10 1/2, up 59 1/2 cents for the month. SRW wheat continues to build bullish momentum, with activity over the month of April erasing losses seen during March. Resistance on the market's monthly chart remains at $5.71 3/4, a price that marks the 33% retracement level of the previous major downtrend from $9.47 1/4 through the low of $3.86 3/4.
To track my thoughts on the markets throughout the day, follow me on Twitter: www.twitter.com\DarinNewsom

Comments
To comment, please Log In or Join our Community .