

Technically Speaking
Monthly Analysis: Energy Markets
Crude Oil: The spot-month contract closed at $68.57, up $3.63 on the monthly chart. The market remains in a major (long-term) uptrend with the spot-month contract testing resistance between $66.42 and $72.36. These prices mark the 33% and 38.2% retracement levels of the previous major downtrend from $147.27 through the low of $26.05. Monthly stochastics are above the overbought level of 80%, keeping the market in place for a bearish turn.
Distillates: The spot-month contract closed at $2.1674, up 13.90cts on the monthly chart. The market resumed its major (long-term) uptrend as the spot-month contract posted a new high of $2.1918 in April. However, monthly stochastics are well above the overbought level of 80%, putting the market in position for a bearish turn.
P[L1] D[0x0] M[300x250] OOP[F] ADUNIT[] T[]
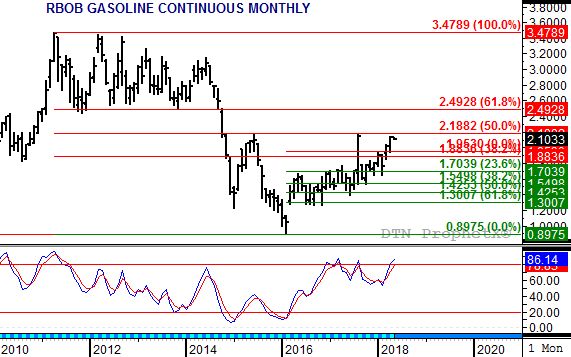
Gasoline: The spot-month contract closed at $2.1292, up 11.13 cents on the monthly chart. The major (long-term) trend of the futures market remains up with the spot-month testing resistance at $2.1882. This price marks the 50% retracement level of the previous downtrend from $3.4789 through the low of $0.8975. Monthly stochastics are nearing the overbought level of 80%.
Ethanol: The spot-month contract closed at $1.445, down 0.9ct on the monthly chart. The major (long-term) trend is sideways with support at a series of lows near $1.292 and resistance at $1.712. A bearish factor remains the spike below support to $1.251 during December 2017.
Natural Gas: The spot-month contract closed at $2.763, up 3.0cts on the monthly chart. The market remains in a wide-ranging major (long-term) sideways trend with support at $2.521. Monthly stochastics are still neutral-to-bearish.
Propane (Conway cash price): Conway propane closed at $0.7900, up 12.75cts on its monthly chart. Despite its higher monthly close the market remains in a major (long-term) downtrend. The secondary (intermediate-term) uptrend looks to be Wave B (second wave) of a 3-wave pattern, with resistance between $0.8291 and $0.8868. These prices marks the 61.8% and 76.4% retracement levels of Wave A from $0.9800 through the low of $0.5850.
To track my thoughts on the markets throughout the day, follow me on Twitter: www.twitter.com\DarinNewsom

Comments
To comment, please Log In or Join our Community .