

Technically Speaking
Weekly Analysis: Corn and Soybean Markets

Corn (Cash): The DTN National Corn Index (NCI.X, national average cash price) closed at $3.07 1/4, up 1 3/4 cents for the week. For now the secondary (intermediate-term) trend could still be considered sideways. The NCI.X needs to see a weekly close above its previous high weekly close of $3.08 1/2 to indicate a move into a normal seasonal uptrend that tends to last through early June (for more information, see last Friday's Newsom on the Market column "Knowing When to Walk Away").
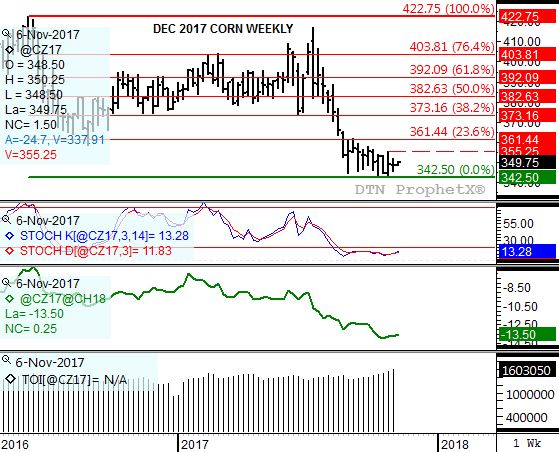
Corn (Old-crop Futures): The December 2017 contract closed 0.50ct lower at $3.48 1/4. The contract's secondary (intermediate-term) trend still looks to be sideways, though nearing a potential move to a seasonal uptrend. Weekly stochastics have flattened out below the oversold level of 20%, establishing yet another bullish crossover with last Friday's close. Support is at the recently posted contract low of $3.42 1/2 with initial resistance the 4-week high of $3.55 1/4. A move above this mark would confirm the beginning of a seasonal uptrend.
P[L1] D[0x0] M[300x250] OOP[F] ADUNIT[] T[]
Corn (New-crop Futures): The December 2018 contract closed 1.00ct lower at $3.93 1/2. December 2018 corn's secondary (intermediate-term) trend remains sideways, consolidation in a narrowing wedge formation. Weekly stochastics remain below the oversold level of 20%, indicating the market could start to build bullish momentum leading to an upside breakout. Trendline resistance this week is calculated at $3.99 1/4 with trendline support at $3.91 1/4.
Soybeans (Cash): The DTN National Soybean Index (NSI.X, national average cash price) closed at $9.02 1/2, up 6 1/4 cents for the week. The NSI.X continues to consolidate between a downtrend connecting the highs of $9.62 1/2 (week of July 10) and $9.22 3/4 (week of October 9) and an uptrend connecting the lows of $8.40 (week of June 19) and $8.60 1/2 (week of August 14). Weekly stochastics are neutral-to-bullish, with the most recent secondary signal was a bullish crossover below the oversold 20% level the week of June 5.
Soybeans (Old-crop Futures): The January 2018 contract closed at $9.86 3/4, up 1/4 cent for the week. The contract's secondary (intermediate-term) trend still looks to be sideways-to-up, though last week's late sell-off led to a test of trendline support at $9.86 1/4. This puts the contract in position to take out this week's trendline support calculated at $9.90. However, weekly stochastics remain bullish indicating upside momentum could strengthen once again. If so, trendline resistance is calculated at $10.00 1/4.
Soybeans (New-crop Futures): The November 2018 contract closed at $9.98 1/2, up 1 1/4 cents for the week. The contract remains in a standard 5-wave secondary (intermediate-term) uptrend. Theoretically the peak of the next wave, Wave 3, should occur above the Wave 1 high of $10.28 3/4.
To track my thoughts on the markets throughout the day, follow me on Twitter: www.twitter.com\DarinNewsom
Comments
To comment, please Log In or Join our Community .