

Technically Speaking
Monthly Analysis: Energy Markets
Brent Crude Oil: The spot-month contract closed at $56.79, up $4.41 on the monthly chart. The spot-month contract traded above the previous high of $58.37 before closing back above this level. The move to a new high of $59.49 opens the door to a possible test of major resistance at $65.80, a price that marks the 38.2% retracement level of the previous downtrend from $128.40 through the low of $27.10.
Crude Oil: The spot-month contract closed at $51.67, up $4.44 on the monthly chart. The major (long-term) trend remains down. The ongoing rally resulted in a test of resistance at $52.13, a price that marks the 76.4% retracement level of the initial sell-off from $55.41 (January 2017) through the low of $46.04 (June 2017). The next wave down could result in a test of support between $40.65 and $37.20.
P[L1] D[0x0] M[300x250] OOP[F] ADUNIT[] T[]
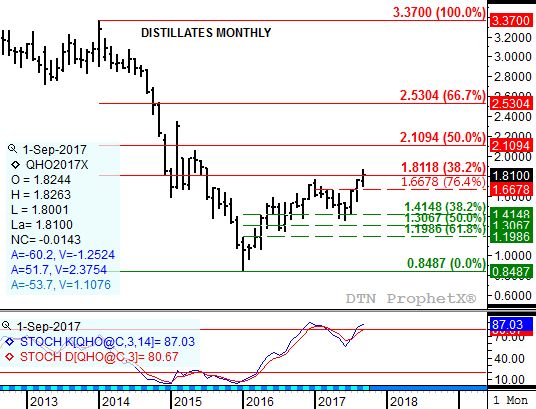
Distillates: The spot-month contract closed at $1.8100, up 5.25cts on the monthly chart. The market in a major (long-term) uptrend as it tests resistance at $1.8118. This price marks the 38.2% retracement level of the previous downtrend from $3.37 through the low of $0.8487. Monthly stochastics have climbed back above the overbought level of 80%, putting the market in position for a possible bearish turn.
Gasoline: The Chicago cash RBOB market closed at $1.6810, down 24.32cts on its monthly chart. The market remains in a major (long-term) sideways-to-up trend. Resistance is at the 4-month high of $1.9577, support the 4-month low of $1.4378.
Ethanol: The spot-month contract closed at $1.506, down 4.1cts on the monthly chart. The major (long-term) trend remains sideways. Resistance is at $1.712, a price that marks the 23.6% retracement level of the previous downtrend from $3.07 (July 2011) through the double-bottom low of $1.292 (January 2015 and January 2016). Support is at the double-bottom low.
Natural Gas: The spot-month contract closed at $3.007, down 3.8cts on the monthly chart. Natural gas remains in a 3-wave downtrend with the February 2017 low of $2.522 the bottom of Wave A (first wave). The May high of $3.431 was not only a test of resistance at $3.432, the 61.8% retracement of Wave A, but also the peak of Wave B. Wave C would now be expected to move below the Wave A low. Monthly stochastics remain bearish.
Propane (Conway cash price): Conway propane closed at $0.8500, up 11.12cts on its monthly chart. Cash propane extended its rally beyond the previous high of $0.9100, with next major resistance at $1.0126. This price marks the 61.8% retracement level of the previous downtrend from $1.4825 through the low of $0.2525. Monthly stochastics are bullish below the overbought level of 80%, meaning there is more room to the upside on the market's monthly chart.
To track my thoughts on the markets throughout the day, follow me on Twitter: www.twitter.com\DarinNewsom

Comments
To comment, please Log In or Join our Community .