

Fundamentally Speaking
2019 Planting and Crop Estimates Analysis
Even though we are just starting to harvest the 2018 row crops, attention has turned to next year already with regard to planting intentions and specifically the mix of crops farmers will seed.
A couple of thoughts on the recent USDA paper on how they arrived at granting soybean farmers $1.69 per bushel in trade relief yet gave corn farmers only one cent per bushel. This is based on the USDA model of calculating damage from trade value without the retaliatory tariffs and with those tariffs.
P[L1] D[0x0] M[300x250] OOP[F] ADUNIT[] T[]
The USDA says that trade values have been much greater in beans than corn which is true, but clearly the plunge in soybean values has pressured corn prices to some extent. This is expected to lead to increased U.S. corn planted area next year, less soybean acreage and this clearly has had a dampening effect at least on forward-corn values if not nearby contracts.
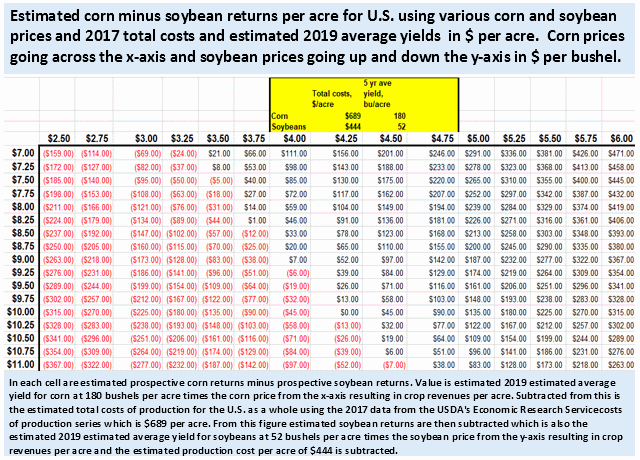
The markets have to contemplate the fact that crop yields are increasing faster than demand, suggesting we could be in an era of high stockpiles and low prices for the foreseeable future. The accompanying graphic looks at hypothetical returns from planting corn and soybeans next year with various prices using what we see as the average five year yield for 2019 and the 2017 national corn and soybean total costs of production from the USDA’s Economic Research Service (ERS) commodity cost and returns data series.
The corn yield is put at 180 bushels per acre (bpa) with their total costs at $689 per acre with the soybean yield at 52 bpa and its total costs projected at $444 per acre. Crop revenues are the price times the yield from which total costs are subtracted. We do that first for corn and then subtract the estimated soybean returns.
As an example in the intersection of the $4.25 corn price and the $10.00 soybean price has $0.00 in the cell. This is arrived at by taking $4.25/bu times 180 bpa equals $765. From this we subtract the total corn costs of $689 leaving net corn returns at $76/acre. Then we subtract the estimated soybean returns which is $10.00/bu times 52 bpa equaling revenues of $520 from which we subtract total costs of $444 which results in soybean returns of $76 when subtracted from the corn returns is zero.
From this table it appears that given current forward prices for both corn and soybeans it will be difficult to net out a profit and recent prospective crop budgets from various university sites paint a similar picture.
(BAS)
© Copyright 2018 DTN/The Progressive Farmer. All rights reserved.

Comments
To comment, please Log In or Join our Community .