
Fundamentally Speaking
Winter Wheat Rating 2nd Lowest Since 1996/97
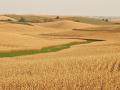
Given the ongoing drought in the Central and Southern Plains, it was no surprise that the USDA in its first crop progress report of the calendar year reported that a large part of the nation's winter wheat crop is in dismal shape.
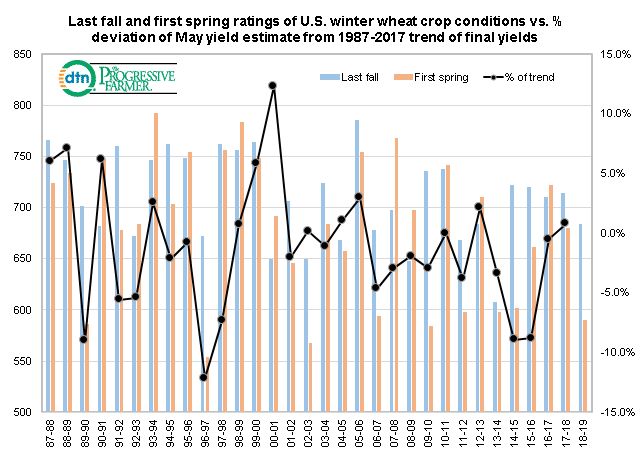
This graphic shows the USDA national crop ratings for the U.S. winter wheat crop two different times, one being the last fall rating that occurs the final week of November and the other the first spring rating that is seen the first week of April.
We use our usual ratings system where we weight the crop based on the percent in each category and assign that category a factor of 2 for VP, 4 for P, 6 for F, 8 for G, and 10 for EX and then sum the results.
P[L1] D[0x0] M[300x250] OOP[F] ADUNIT[] T[]
These ratings are plotted vs. the percent that the first USDA winter wheat yield forecast given in May deviates from the 1987-2017 trend of final winter wheat yields.
Conditions as of the end of last November were the lowest since 2013 but not appreciably so with a rating of 684 which was also seen in the 2012/13 season yet the May 2013 yield estimate came in 2.1% above trend as conditions improved over the winter as the first spring rating that year was 710.
Not the case this past winter as growing conditions even over the time when the crop was in dormancy were horrible with the largest producing state Kansas seeing the second lowest Dec-Feb moisture in over 40 years.
This, along with episodes of bitter cold with no protective snow cover that is thought to have caused large incidences of winterkill have resulted in the first spring rating for the 2018 crop at 590, the lowest rating since 2010 when the May yield estimate was 2.9% below trend and the second lowest rating since the 1996/97 season when the May 1997 yield figure was 12.2% below trend.
The 94-point decline from the final fall rating to the first spring rating is also the fifth largest over the past 30 years.
Note also while the correlation between the final fall rating and yields is a weak 10.5% correlation that jumps to 52.9% for the first spring rating.
(KA)

Comments
To comment, please Log In or Join our Community .