

Canada Markets
March Canola Treads Water Amid Uncertainty

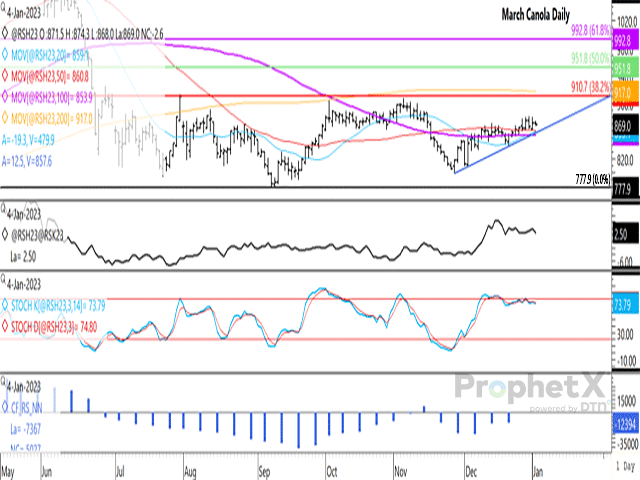
The last day of 2022 saw the March canola contract reach its highest trade in six weeks at $881/metric ton, only to close lower at the session's end. Jan. 3 trade came within $1/mt of testing this level, while Jan. 4 trade saw the March contract end $2.60/mt lower, consolidating within the previous session's range in a sideways move.
Wednesday's March volume at 20,999 contracts was the highest daily volume seen during the life of the contract, while price moved over a narrow $6.30/mt range, which compares to the four-day average range of $15.30/mt range. Price remains supported by commercial activity. A look at the attached chart shows the March holding above the contract's 20-, 50- and 100-day moving average, while is above trendline support at $857.60/mt, drawn from the Nov. 28 low.
P[L1] D[0x0] M[300x250] OOP[F] ADUNIT[] T[]
The first study on the chart shows the March/May futures spread weakening to $2.50/mt (March above the May), while continuing to reflect a bullish inverse since moving into inverted territory on Dec. 9. The May/July spread also reflects an inverse of $0.70/mt, continuing to reflect a bullish fundamental situation through the end of the crop year.
The histogram on the lower chart is missing a bar and should show the noncommercial net-short position falling for a third week to 7,367 contracts over the week ending Jan. 27, rather than the 12,394 contracts shown. This is the smallest bearish position shown over a six-week period, as speculators pare their short positions and overall risk in this market.
In addition to the trendline support indicated at $857.80/mt, support also lies at the 50-day moving average at $860.80/mt and the 100-day at $853.90/mt. A further move upside will face resistance at last week's high at $881/mt, psychological resistance at $900/mt and the 38.2% retracement of the move from the contract's April high to September low at $910.70/mt.
Cliff Jamieson can be reached at cliff.jamieson@dtn.com
Follow him on Twitter @Cliff Jamieson
(c) Copyright 2023 DTN, LLC. All rights reserved.
Comments
To comment, please Log In or Join our Community .