

Canada Markets
March Spring Wheat Bounces From Technical Support
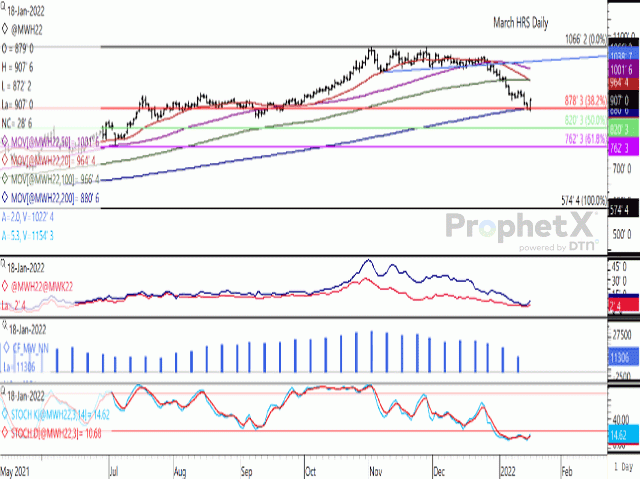
March MGEX hard red spring wheat closed 28 3/4 cents higher on Tuesday following the U.S. long weekend, the first higher close in four sessions, returning to close above $9/bushel (bu). This is the largest daily move higher seen on the continuous active chart seen since July 12, when drought across the North American spring wheat area was top of mind.
March hard red spring wheat dipped to its lowest level in almost four months on Tuesday at $8.72 1/4/bu, while bouncing from technical support, signaling a chance that the recent slide is over.
After reaching a $10.66 1/4 high on Nov. 2, this session's low marks a $1.94/bu drop in price. Since breaking lower from a sideways range on Dec. 28, the daily price has fallen in 11 of the following 15 sessions.
P[L1] D[0x0] M[300x250] OOP[F] ADUNIT[] T[]
Tuesday's low marks a test of the 38.2% retracement of the move from the contract's low at $5.74 1/2/bu to the contract high at $10.66 1/4/bu, calculated at $8.78 1/4/bu. The Jan. 14 close ended at a level equal to this retracement, while the Jan. 18 close pushed higher. Should markets turn lower once again, a sustained breach of this line could lead to a further move to the 50% retracement of the move discussed, which is calculated at $8.20 1/4/bu.
Additional support is being tested at the contract's 200-day moving average at $8.80 3/4/bu, which has been tested during the past two sessions and for the first time during the life of the moving average, or since June 10.
The Jan. 18 change in direction resulted in an outside bar or reversal signal formed on the daily chart, with this session's range trading both higher and lower than the previous session's range. A change in trend will be signaled should price reach a four-day high, which is currently shown at $9.33/bu.
The lines on the first study represents the March/May and the May/July futures spreads. While these spreads have collapsed since highs reached in late October/early November, they continue to reflect a bullish inverse. The front-month spread, or March/May (red line), strengthened 1 cent on Tuesday to 2 1/4 cents, with the March continuing to close over the May contract.
Since reaching an all-time high in the week ending Nov. 2, noncommercial traders have pared their bullish net-long position in spring wheat by 61.6% as of Jan. 11 to 11,306 contracts, which has fallen in eight of the past 10 weeks since the all-time high of 29,470 contracts was reached. This is shown by the blue histogram bars on the second study.
The lower study shows the stochastic momentum indicators on the daily chart showing a bullish cross while prices are in oversold territory, which supports a potential change in trend.
Cliff Jamieson can be reached at cliff.jamieson@dtn.com
Follow him on Twitter @Cliff Jamieson
(c) Copyright 2022 DTN, LLC. All rights reserved.

Comments
To comment, please Log In or Join our Community .