

Technically Speaking
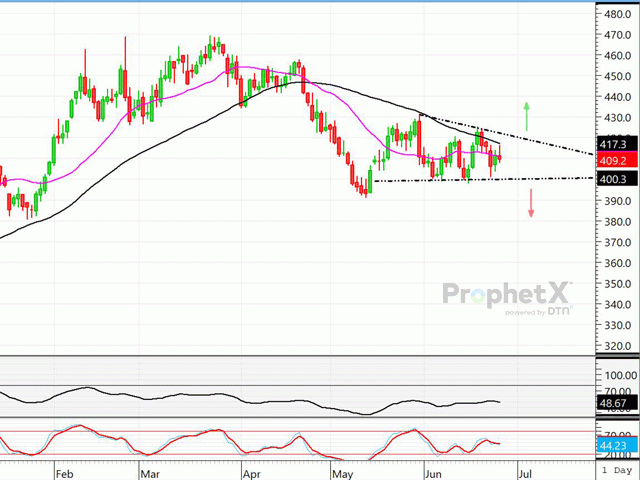
August Soybean Meal Futures Coiling for a Breakout?

August soybean meal, until just recently, has been everybody's short leg in the soy complex. On May 12, the bearish move seemed to end, with meal rising. Now, that strength again appears to be in jeopardy. August meal appears to be moving sideways within a triangle pattern, which could be considered a continuation of the overall bearish trend. It would appear that a breakout below $400 would lead to another leg lower. The bearish pattern, called a "descending triangle", would be negated on a solid close above $420 to $421. Momentum indicators, such as relative strength index (RSI), and slow stochastics are both neutral, giving no hint as to which way this market might resolve.
KANSAS CITY SEPTEMBER FUTURES:Although there is very little that is bullish about wheat's price action lately, a look at the KC September chart would show that this is a market that is about as oversold as any that I have seen in the last few years. The market is down just shy of $4.00 per bushel just since the high on May 17. Since the invasion of Ukraine by Russia in late February, taking the major portion of Ukraine wheat exports off of the world market, world supplies have tightened for major exporters. Even with the drought in U.S. hard red winter country, and severely late planting of the spring wheat crop, wheat futures have inexplicably plunged. The oversold nature of the market is not a reason to expect a rally tomorrow, but sure cautions about pressing the downside from here. However, after some minor support at $9.82, which we tested early on Monday, the next level of support is way down near $9.50 on KC September.
NOVEMBER SOYBEAN FUTURES:Although the chart on November soybeans sure doesn't exude confidence for bullish traders, the $14.00 support area appears to be one that could stop the bleeding for a bit at least. The $14.00 area shows what is called a "tweezer bottom" -- the Japanese candlestick answer to a double bottom. Momentum indicators appear to be rolling over to the upside.
P[L1] D[0x0] M[300x250] OOP[F] ADUNIT[] T[]
With longer-term forecasts currently agreeing on the return of a hotter and drier pattern for the central U.S. for July-August, this would make sense, as we typically get some sort of summer rally in December corn and November beans.
**
Comments above are for educational purposes only and are not meant as specific trade recommendations. The buying and selling of grain or grain futures or options involve substantial risk and are not suitable for everyone.
Dana Mantini can be reached at Dana.Mantini@DTN.com
Follow him on Twitter @mantini_r
(c) Copyright 2022 DTN, LLC. All rights reserved.


Comments
To comment, please Log In or Join our Community .