Fundamentally Speaking
Weather, Price Behind Changes in Spring Wheat Planted Area
USDA will release their Prospective Plantings report this week and while most attention will be on the corn and bean figures, we have more than a passing interest in what USDA says about spring wheat acreage.
The NASS Winter Wheat and Canola Seedings report estimated 2022 winter wheat seeded area at 34.4 million acres, up 2% from 2021/22 and the largest since 2016/17.
USDA notes that combined spring and durum wheat plantings for 2022/23 are also projected higher although constrained by favorable prices for alternatives beyond corn and soybeans in the Northern Plains, including minor oilseeds, other small grains, and pulses.
At their February Ag Outlook Forum, USDA pegged total wheat planted area for 2022/23 at 48.0 million acres, up nearly 1.3 million acres from last year and the highest wheat area since 2016/17 which would leave combined spring and durum acreage at 13.6 million acres.
Trade guesses for Thursday's intention numbers have spring wheat acres projected at 11.80 mln and 1.73 mln for durum so combined a bit lower than USDA's projection.
P[L1] D[0x0] M[300x250] OOP[F] ADUNIT[] T[]
The first half of this month, USDA economists surveyed a number of farmers on what their planting intentions were and will release those on March 31.
These figures will be updated at the end of June and then a final figure will be given in the annual production report in January.
There can be large differences between the March Prospective Plantings, June Acreage, and final production numbers for planted area of the major crops where changing prices and Mother Nature can have a large say in what farmers intend to put in the ground and what they actually seed.
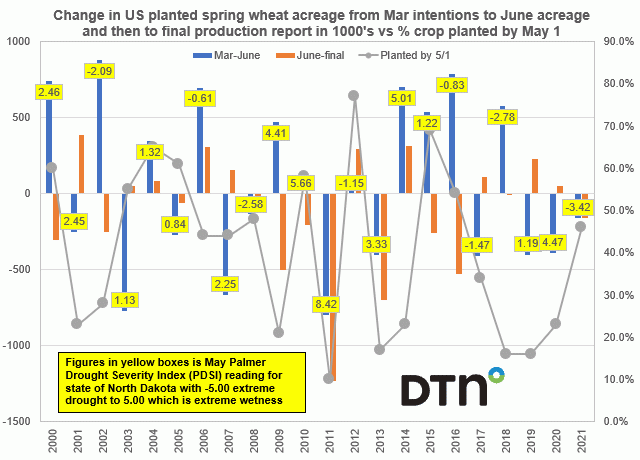
Along these lines this graphic shows the change in U.S. planted spring wheat acreage from the March intentions report to the June acreage projections and then to the final production report in 1000's on the left-hand axis vs. the percent of the crop planted by May 1 on the right-hand axis.
Assuming that weather may have some influence on changes in planted spring wheat area, the figures in the yellow boxes is the May Palmer Drought Severity Index (PDSI) reading for the state of North Dakota with -5.00 extreme drought to 5.00 which is extreme wetness though values can and have exceeded both figures at times.
We choose North Dakota to proxy soil moisture conditions for the spring wheat planted area since that state has and still accounts for about half of U.S. spring wheat output.
Looking at the graphic it's no real surprise that in years when a low percent of the crop is seeded by May 1 are often the years when final spring wheat acreage is below what the March intentions figure indicated.
In 2011, from the March to June to final production report planted area fell by 2.033 million acres as only 10% of the crop was seeded as of May 1 no doubt due to the super saturated ground as evidenced by the 8.42 North Dakota May PDSI reading.
We see a similar situation in 2013 when March to final planted area fell by 1.105 million acres, a year when only 17% of the crop was seeded as of May 1, well behind the 2000-2021 average of 41% with a 3.33 North Dakota May PDSI reading.
There are, however, years such as 2009 and 2014 where you also had a laggard planting pace and a high ND PDSI reading yet acreage either stayed the same or actually increased suggesting price considerations also at play.
All of this is part of the big acreage battle shaping up this year as all crops in all areas of the country are trying via very enticing forward values to stake their claim for part of what has been a limited to declining farmland base over the years.
(c) Copyright 2022 DTN, LLC. All rights reserved.


Comments
To comment, please Log In or Join our Community .