
Fundamentally Speaking
Increases in Soybean Acreage, Output & Yields

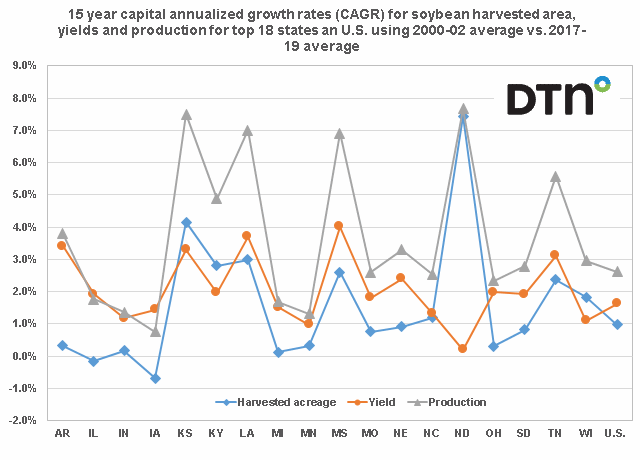
Similar to what we did with corn, this chart shows the 15-year capital annualized growth rates (CAGR) for soybean harvested acreage, yields and production for the top 18 producing states and U.S.
What is different is in corn we used the 20-year CAGR going from 2000 to 2020, but for soybeans last year's wild spring weather played havoc with soybean plantings as the very delayed seedings resulted in total U.S. harvested acreage coming in at 75.0 million acres, the lowest since 2013 and well below the 87.6 million that was harvested in 2018
There were also many of the top 18 states that also saw what we view as an unrealistic drop in 2019 harvested acreage vs. 2018 and no doubt the 2019 yield and production figures were also affected.
P[L1] D[0x0] M[300x250] OOP[F] ADUNIT[] T[]
Therefore we used the 2000-2002 average for harvested area, yields and production and compared that to the 2017-2019 average in order to get a truer picture of how harvested soybean acreage, yields and production has changed over the past 20 years in the largest producing states.
As we have discussed in prior pieces, the geographical distribution of soybean output has changed over the past two decades away from parts of the Corn Belt, particularly eastern sections, to the Delta and Plains states.
Soybean returns have exceeded those of other crops that used to be seeded in these areas with peanuts and tobacco in the Delta and sorghum and wheat in the Plains being replaced.
As we saw in corn, North Dakota again has boosted their production the most since 2000 with their soybean output increasing by an average of 7.7% annual based on a 7.5% rise in harvested area per year offsetting yield growth which has been flat.
Kansas which was second in corn growth is also second in soybean production averaging an annual gain of 7.5% with harvested acreage up 4.1% and yields increasing by an average of 3.3% per annum.
Also seeing strong annual percent gains in output for Louisiana, Mississippi and Tennessee.
On the other hand, the rate of output has really slowed in Iowa and other states in the Midwest with flat or actually falling harvested area offset by slight gains in yields.
(KLM)
© Copyright 2020 DTN/The Progressive Farmer. All rights reserved.
Comments
To comment, please Log In or Join our Community .