Canada Markets
November Canola Closes Lower but Has a Good Week
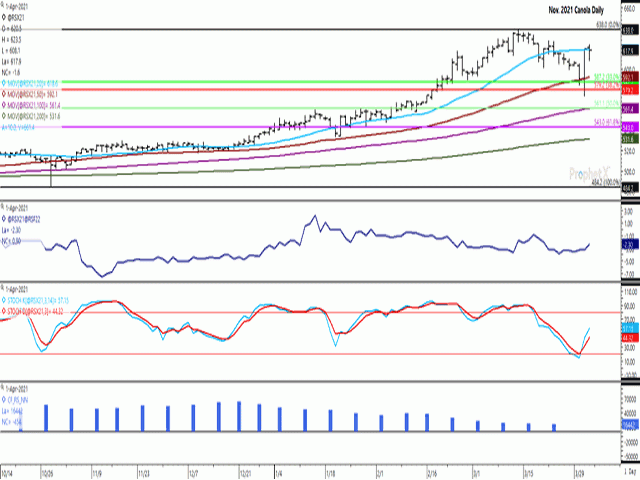
November canola failed to sustain gains from follow-through buying during the April 1 overnight session, although there are some interesting signs when it comes to new crop trade, as seen in soybeans, soybeans oil, canola and corn trade this session.
The November canola contract finished just $1.60/metric ton lower this session, at $617.90/mt, while gaining $14.10/mt during the week, the first weekly gain in three weeks. This compares to the $16.30/mt loss seen in the nearby May contract on April 1, resulting in a $10.70/mt loss this session and $60.30/mt over three weeks.
P[L1] D[0x0] M[300x250] OOP[F] ADUNIT[] T[]
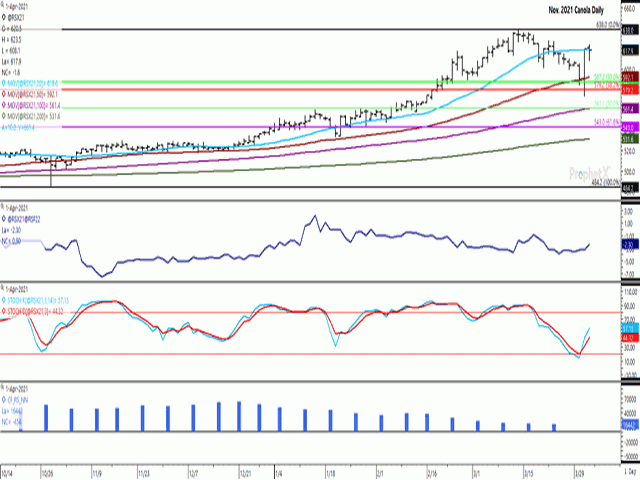
This week's support was found after reaching the contract's lowest trade in six weeks, while testing the support of the 38.2% retracement of the move from the contract's October low to March high, calculated at $579.20/mt, shown by the horizontal red line on the chart. As well, psychological support is seen at the $600/mt level, which has acted as a floor during the past three weeks.
Today's Nov21/Jan22 future spread narrowed by $0.90/mt to minus $2.30/mt. This compares to the five-year average spread on this day of minus $4.60/mt (Nov trading under the Jan). This is the narrowest spread seen on this date since April 1 2015, when the spread was minus $1/mt, a time when AAFC was forecasting the 2015-16 ending stocks to fall from 1.450 million metric tons in 2014-15 to 1.4 mmt in 2015-16, while ending stocks reported on Statistics Canada tables for that crop year are currently shown at 2.091 mmt.
The lower study of the attached chart shows the histogram representing the trend in the net-futures position held by noncommercial traders or speculators. This reached a record high of 62,432 contracts as of Dec. 21, while has trended lower to 16,442 contracts as of March 23, while the March 30 should be even lower. This week's bullish soybean report from the USDA could see this group return to support prices.
Cliff Jamieson can be reached at cliff.jamieson@dtn.com
Follow him on Twitter @Cliff Jamieson
(c) Copyright 2021 DTN, LLC. All rights reserved.


Comments
To comment, please Log In or Join our Community .