Canada Markets
A Look at the USDA's Global Canola/Rapeseed Estimates
Waiting for government data to converge with what is perceived is happening in the marketplace can take patience, as row crop market watchers will attest to.
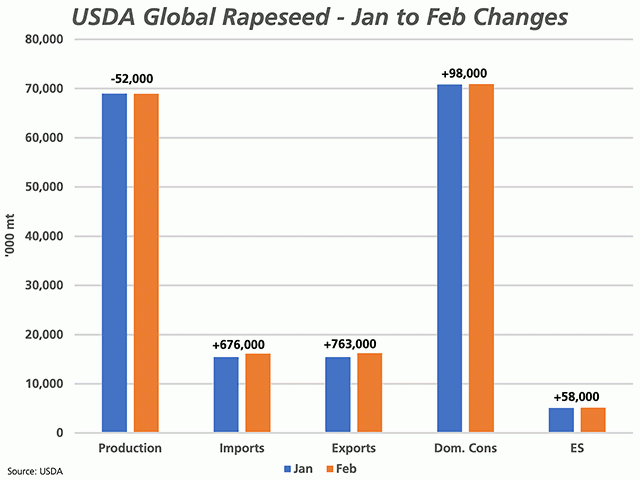
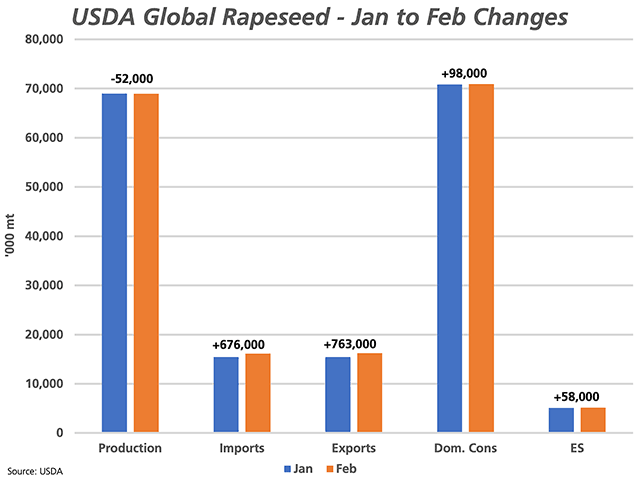
The USDA's February Oilseeds: World Markets and Trade report data for global rapeseed/canola shows a modest reduction in global production of 52,000 metric tons this month to 68.934 million metric tons. In addition, both imports (up 676,000 mt) and exports (up 763,000 mt) were revised higher this month, while domestic consumption or disappearance is increased by only a modest 98,000 mt. The end result this month was a 58,000-mt increase in global ending stocks to 5.141 mmt, representing a 7.2% stocks-to-use ratio. While this is the lowest stocks-to-use ratio calculated in 17 years using USDA data, or since 2003-04, it is only 0.1 percentage point lower than the 7.3% calculated for 2016-17.
P[L1] D[0x0] M[300x250] OOP[F] ADUNIT[] T[]
If you go back to September, early in Canada's 2020-21 crop year, global ending stocks were reported by the USDA at a high for this crop year at 5.236 mmt, while despite everything that has happened since on both the supply and demand side of the equation, stocks have only been revised 95,000 mt lower since.
This month, the USDA revised higher its forecast for Canada's exports from 10 mmt to 10.7 mmt, close to the 10.9 mmt forecast released by Agriculture and Agri-Food Canada. This is significant in that this volume represents 65.9% of the USDA's global export forecast. At the same time, Canada's ending stocks were revised downward to 1.2 mmt this month, which is equal to the most recent AAFC forecast. AAFC released its January forecast prior to the Feb. 5 Statistics Canada Dec. 31 grain stocks report that showed 12.1 mmt of canola remaining, down 3.8 mmt from December 2019. When the current pace of demand is taken into account, Canada's ending stocks could be closer to zero than to the current 1.2 mmt estimate.
Further revisions to global data in the months to come should continue to reflect the bullish fundamental situation the we see in Canadian data.
Cliff Jamieson can be reached at cliff.jamieson@dtn.com
Follow him on Twitter @CliffJamieson
(c) Copyright 2021 DTN, LLC. All rights reserved.


Comments
To comment, please Log In or Join our Community .