Canada Markets
Statistics Canada Pea Stocks Estimates May be Tested
Agriculture and Agri-Food Canada's June supply and demand tables saw few changes from the previous month. July estimates will be of far more interest when more accurate seeded acre estimates are included, with Statistics Canada set to release this data on June 29.
AAFC left the estimate for dry pea exports at 3.650 million metric tons, leading to an estimated carryout for 2019-20 at 300,000 metric tons, down 3.8% from the previous crop year and 29% below the five-year average.
At the same time, we've previously noted that Statistics Canada's April merchandise trade report showed a cumulative 2.835 mmt of peas exported as of April, a pace that is ahead of the 2018-19 pace and the five-year average, while a volume that is higher than the volume of exports needed this month in order to reach the government forecast.
P[L1] D[0x0] M[300x250] OOP[F] ADUNIT[] T[]
When the year-over-year change in exports is taken into account, AAFC is forecasting an 11.6% year-over-year increase in exports for 2019-20, from 3.270 mmt in 2018-19 to 3.650 mmt in 2019-20. As of the most recent week 45 Grain Statistics Weekly, exports though licensed facilities are 28.5% higher than the same period in 2018-19.
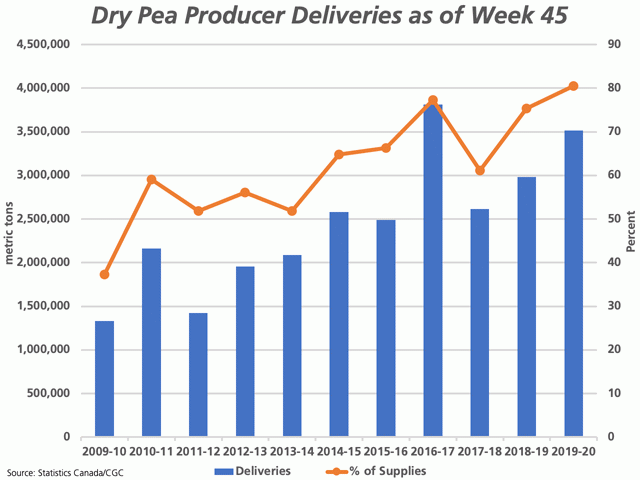
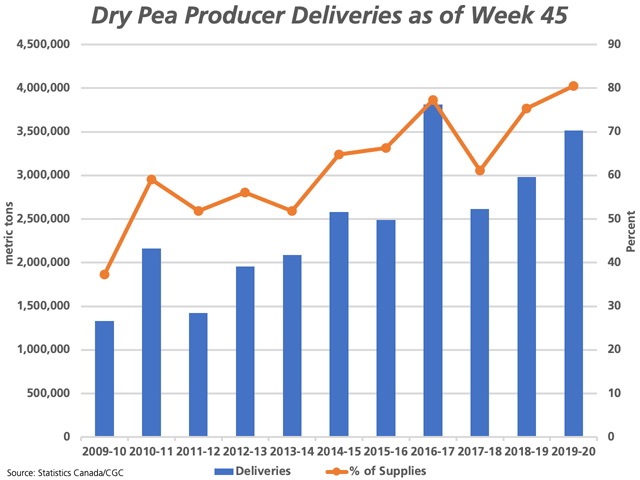
The attached chart represents producer deliveries into the licensed handling system. As of week 45, producers had delivered 3.5174 mmt, up 17.9% from the same period in 2018-19 and ahead of the five-year average of approximately 2.9 mmt for this period.
It is interesting to note that this volume represents 80.5% of crop year supplies (excluding imports). This is calculated with the sum of the July 31 stocks which is added to the following crop year's production. Over the past five years an average of only 69% of crop year supplies are delivered over this period, while this percentage is calculated at 60% on average over the past 10 years.
From this, one could conclude that if production estimates and previous stocks estimates are accurate, farm stocks are tight. Alternatively, one could view these estimates as understated, and producer deliveries could perhaps be more in line with previous years as a percentage of total supplies.
One thing that jumps out today is STATpub.com price data, which shows No. 1 yellow peas at an average of $9.67/bushel delivered to Saskatchewan plants for No. 1, while $7.35/bu. for No. 2s. This is up from last week showed bids at $7.30/bu. for No. 1. This could suggest that supplies are quickly tightening and this bears watching.
Cliff Jamieson can be reached at cliff.jamieson@dtn.com
Follow him on Twitter @Cliff Jamieson
© (c) Copyright 2020 DTN, LLC. All rights reserved.


Comments
To comment, please Log In or Join our Community .