Canada Markets
A Look at the HRS and HRW Spread
As of June 14, the United States winter wheat harvest was estimated to be 15% complete, equal to the five-year average. It is early in both the hard red winter wheat harvest as well as the spring wheat growing season, but the markets may be sending a signal of the market's view of the wheat harvest and the demand for higher quality wheat.
A quick look at the Kansas Wheat Harvest Report released over the past three days shows references to good yields and bushel weight, while protein is indicated to be running below normal.
The market may be signaling concern and bears watching. Since reaching a recent high of $4.76 3/4 per bushel on June 4, July hard red winter wheat has closed lower in eight of the past nine sessions, including a 5 3/4-cent loss on June 17 while reaching a 12-week low. At the same time, July hard red spring wheat has fallen in just three of the nine sessions, ending unchanged in another three and closing higher in three sessions, including a 5 1/4-cent move higher in June 17 trade.
The spread between these two markets is viewed as a potential sign of increasing demand for high quality spring wheat when compared to the lower-quality HRW.
P[L1] D[0x0] M[300x250] OOP[F] ADUNIT[] T[]
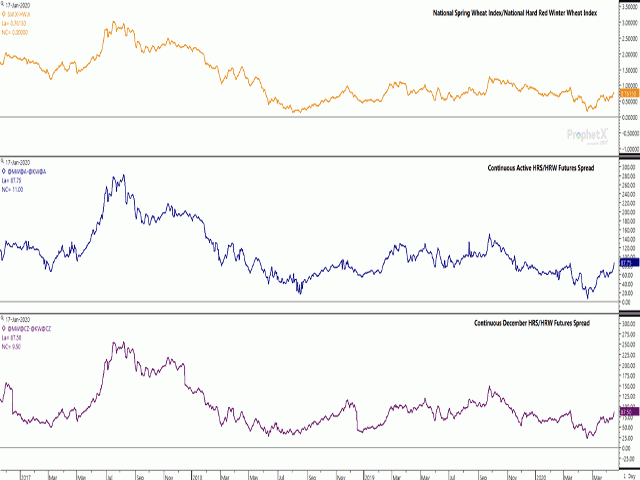
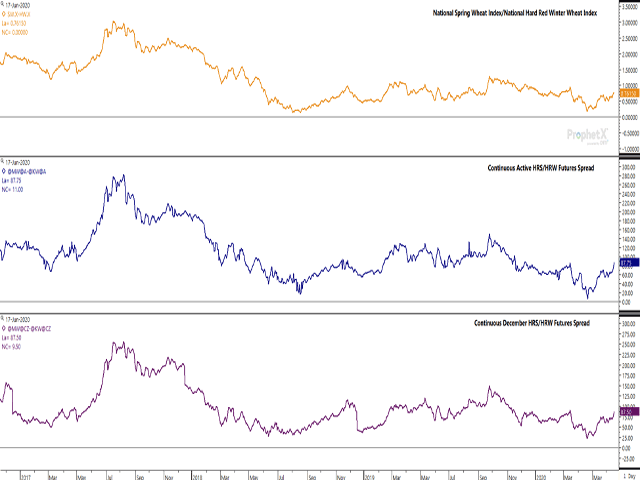
The three studies on the attached chart looks at the: 1) cash market spread, as calculated using the difference between DTN's National Spring Wheat Index and National Hard Red Winter Wheat Index (gold line); 2) the spread between the continuous active HRS future and the continuous active HRW future (blue line); and 3) the continuous December HRS and December HRW futures spread (purple line).
All three studies show a sharp rise higher in recent trade (HRS strengthening relative to HRW), which includes a $0.16-cent move higher this week in the cash market to $0.76/bu. ($0.27), a 23-cent move higher this week on continuous active futures chart to $0.8775 ($0.2375) and on the lower study, an $0.185 gain to $87.50/bu. ($.3125), with the most recent April lows in brackets.
When compared to the five-year average for the 2014-15 through 2018-19 Canadian crop years (Aug. 1 to July 31) for each spread, only the continuous December spread has move above its five-year average of $0.7789/bu.
Despite the strengthening spreads, track Portland basis for No. 1 DNS has failed to react and has shown signs of weakness in recent months, which bears watching.
**
DTN 360 Poll
This week's poll asks which crop you are most comfortable storing and carrying into the next crop year. Feel free to share your thoughts on this week's poll, found on the lower-right side of the DTN Canada site.
Cliff Jamieson can be reached at cliff.jamieson@dtn.com
Follow him on Twitter @Cliff Jamieson
© (c) Copyright 2020 DTN, LLC. All rights reserved.


Comments
To comment, please Log In or Join our Community .