

Technically Speaking
Monthly Analysis: Grain Markets
Corn (Cash): The DTN National Corn Index (NCI.X, national average cash price) closed at $3.46, down 9 cents for the month. Monthly stochastics show the major (long-term) trend is still up while NCI.X price activity since July shows a sideways trend is in place. Support remains between $3.44 and $3.23, prices that mark the 50% and 67% retracement levels of the rally from $2.81 (October 2014 low) through $4.06 (July 2015 high). Initial resistance is at the August 2015 high of $3.65.
Corn (Futures): TheMarch contract closed at $3.72 1/4, down 10 cents on the monthly chart. The major (long-term) trend has turned sideways with support at roughly $3.50 and resistance near $4.00. Monthly stochastics have turned neutral above the oversold level of 20%. Most all market indicators are neutral at the end of November.
P[L1] D[0x0] M[300x250] OOP[F] ADUNIT[] T[]
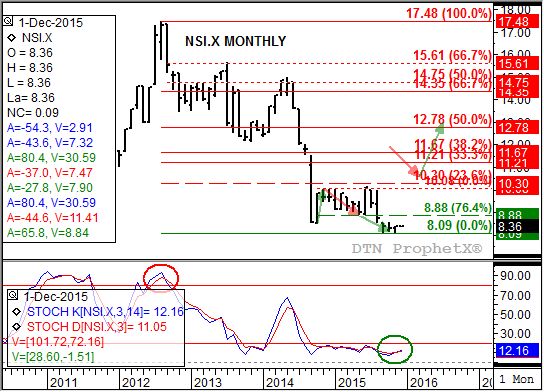
Soybeans (Cash): The DTN National Soybean Index (NSI.X, national average cash price) closed at $8.36, up 5 cents for the month. Monthly stochastics (bottom study) for the NSI.X established a bullish crossover below the oversold level of 20%, indicating the major (long-term) trend could turn up. Confirmation of this could come in December following the November close at the monthly high of $8.36 if the NSI.X is able to leave a bullish gap (a breakaway gap) between the December low and November high. Also note that the November low of $8.09 created a possible double-bottom formation with the September 2015 low of the same price.
Soybeans (Futures): The January contract closed at $8.81, down 4.75 cents on the monthly chart. After posting a new low of $8.44 1/4 the January contract was able to rally to close out the month, opening the door for a potential bullish spike reversal. Monthly stochastics remain bullish below the oversold level of 20%, indicating bullish momentum could start to strengthen. Initial resistance is at the October 2015 high of $9.19 3/4.
Wheat (Cash): The DTN National SRW Wheat Index (SR.X, national average cash price) closed at $4.23, down 49 cents for the month. The major (long-term) trend is sideways-to-down with the SR.X pressing support at the low of $4.11 (September 2015). Below that major support might be found at the March 2010 low of $3.73, then the October 2009 low of $3.17.
SRW Wheat (Futures): The March Chicago contract closed at $4.75 1/2, down 46.50 cents on the monthly chart. The major (long-term) trend is sideways with support between $4.70 and $4.60, a range housing a series of lows dating back to September 2014. Below that is the June 2010 low of $4.25 1/2.
To track my thoughts on the markets throughout the day, follow me on Twitter: www.twitter.com\DarinNewsom

Comments
To comment, please Log In or Join our Community .