




2026 Digital Yield Tour - October
DTN Yield Models Trend Up for Corn, Slightly Down for Soybeans
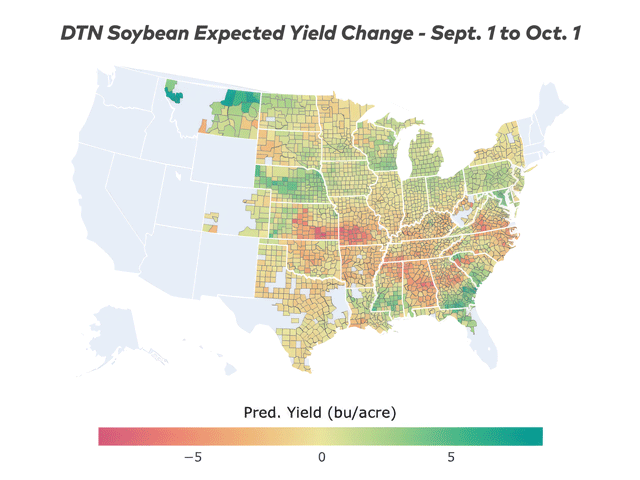
JEFFERSON CITY, Mo. (DTN) -- While September brought record-setting rainfall to portions of the Corn Belt, other regions received much-needed precipitation that reversed dry conditions and benefited the nation's overall corn and soybean crops. The result is the two crops maintained or slightly improved previous yield trajectories, according to updated data from the 2026 DTN Digital Yield Tour.
Based on DTN's proprietary yield models as of Oct. 1, the national average corn yield is projected at 179.5 bushels per acre (bpa), up 1.1 bpa from Sept. 1 model estimates. In soybeans, DTN models estimate the national average yield at 52.2 bpa, down 0.1 bpa from a month earlier. Questions over grain quality issues now linger as the 2026 growing season nears the finish line.
For corn, yield estimates from Sept. 1 to Oct. 1 decreased in six of the 11 states highlighted during the DTN Digital Yield Tour, including Illinois, Minnesota and Wisconsin. South Dakota had the largest yield increase, with models increasing statewide yields from 151.8 bpa to 157.7 bpa. For the second month, the largest decrease came in North Dakota, where the corn yield estimate fell 4.8 bpa, from 133.5 bpa to 128.7 bpa.
For soybeans, yield estimates increased in seven of the 11 states from Sept. 1 to Oct. 1. Nebraska saw the largest increase in its state yield estimate for the second time, rising from 58.6 bpa to 61.1 bpa, according to DTN models. The largest decrease occurred in Kansas, where the soybean yield estimate fell from 37.0 bpa to 35.3 bpa.
OCTOBER WEATHER ROLLERCOASTER
After a mostly dry first week of October, three hurricanes and their remnants are poised to move through the U.S. during the next 10 days, according to DTN Ag Meteorologist John Baranick. The first is Hurricane Isaias, which is forecast to make landfall between Mobile, Alabama, and Pensacola, Florida, on Friday night.
"Extremely heavy rain will develop over the Southeast, but the remnant low will move up toward the Ohio River and spread rain north of it over the weekend," Baranick said. "Rainfall amounts there are still being determined but could reach over an inch in spots. Farther south across Kentucky and Tennessee, rainfall amounts in the 1-to-3-inch range will be possible. Most of the rain should remain east of the Mississippi River."
A second tropical system, Rachel, is presently out in the Pacific Ocean. It is forecast to move northeast through California and the Great Basin on Saturday, Oct. 10, spreading tropical moisture behind a cold front in the Northern Plains for Sunday and into Monday.
"With the cold air in place, accumulating snow looks likely," Baranick noted. "It is difficult to determine exactly where and how much snow will accumulate because of how warm it currently is out there, but there will be some areas that turn white.
"We could see some moderate rainfall across the Dakotas, Minnesota, Wisconsin and Michigan out of this system as well, but across the far northern areas of the Corn Belt, an inch of rain will still be possible, though," he added.
And a third tropical system, Simon, is developing off the southwestern coast of Mexico. Baranick said that storm's current forecast has it moving into New Mexico and west Texas on Tuesday, Oct. 13, bringing potential for heavy rain across some of the same areas that saw heavy rain last week from the remnants of Hurricane Polo.
"With that being five or so days in the future, there could be some changes in the location of the heavy rain potential," he said. "But even so, this remnant low could produce another storm system across the eastern half of the country for the mid- to late portion of next week, producing another round of potential for widespread precipitation and pockets of heavy rain."
Behind this system, temperatures are likely to fall, though the shot of cold is not expected to last long as the pattern returns to a relatively warmer and drier one for the second half of October.
P[L1] D[0x0] M[300x250] OOP[F] ADUNIT[] T[]
WILL WASDE REACT TO WEATHER?
DTN Lead Analyst Rhett Montgomery said that the historic and excessive rainfall events for parts of Iowa and Nebraska have traders expecting USDA to trim average corn yield estimates in its October Crop Production and World Agricultural Supply and Demand Estimates (WASDE) reports.
"The yield story is interesting in 2026 because I think if you'd asked the question of expectations just two weeks ago, most would have probably given guesses very close to USDA's 178.5 bpa estimate (from the Sept. 11 WASDE), and even DTN's refreshed model run of 179.5 bpa wouldn't have seemed too outlandish," Montgomery said. "However, that was before the heavy rains.
"I'm personally using a 175.0 bpa yield in my balance sheet now, but that is purely a mathematical guess based on national crop ratings and trend," he continued. "I also don't believe USDA will cut it to that degree in the October WASDE alone."
The Dow Jones survey of 15 analytic firms has an average trade guess of 177.6 bpa for the national yield, which Montgomery noted would be more in line with the degree to which USDA historically changes its yield forecasts in October. The largest yield reduction in the past 10 October WASDEs was 1.0 bpa in 2016.
"I think it's important to recall that in the September Crop Production report, Iowa was the only 'heartland' state forecasted to produce a larger crop year over year from 2025," Montgomery said. "So, assuming every other state stays relatively even, a drop in the top-producing state will still pull the average lower.
"For Friday, my number to watch is 2.0 bpa, meaning that since USDA found 173 million bushels (mb) of extra corn stocks on hand as of Sept. 1, the yield can drop up to roughly 2.0 bpa (assuming no acreage change) and still result in a net increase to corn ending stocks for 2026-27," he explained. "This, of course, assumes no demand changes either, which is a whole other area for concern as well. Still, there is a good chance with a mild yield cut, our stocks-to-use ratio stays under 11%. This would suggest a $4.50 to $5.00 type price historically but probably keeps the door open for possible spikes through the 2026-27 year back toward 2026 highs."
For soybeans, Montgomery believes a similar sentiment remains true.
"Up until mid-September, there was still a lot of talk for a record-setting national yield in 2026 across the U.S.," he said. "However, considering the rainfall and reported issues across the central to western Corn Belt, expectations have certainly been tempered.
"In that sense, the slight cut DTN's model is showing makes sense," Montgomery said. "I was surprised to see the average trade guess for Friday actually calling for a 0.1 bpa increase to USDA's forecast. There is a large degree of disagreement, though, with a range for the report of 51.4 bpa to 54.1 bpa."
Noting that some models inherently bias rainfall as always being "yield positive," the extreme rainfall in September is going to really test the robustness of each model, he said.
"The same crop ratings model I keep shows 51.7 bpa for a forecast, but take that with a grain of salt," he added. "Overall, it will depend on potential demand shifts, but my feeling is any yield above 53.0 bpa on Friday would lean bearish from where we have been priced recently. There is about a 0.1 bpa of 'insulation' for the yield after USDA found 10 mb less soybean stocks in the U.S. as of Sept. 1 than initially forecasted."
**
2026 DIGITAL YIELD TOUR ESTIMATES AT A GLANCE
CORN (bushels per acre)
| DTN DYT-OCTOBER | DTN DYT-SEPTEMBER | DTN DYT-AUGUST | ||
| National | 179.5 | 178.4 | 178.5 | |
| Illinois | 210.0 | 211.6 | 210.3 | |
| Indiana | 207.0 | 204.7 | 202.2 | |
| Iowa | 219.2 | 217.1 | 214.0 | |
| Kansas | 111.0 | 111.4 | 112.5 | |
| Minnesota | 196.6 | 198.8 | 200.6 | |
| Missouri | 174.4 | 176.2 | 167.5 | |
| Nebraska | 182.9 | 178.7 | 176.3 | |
| North Dakota | 128.7 | 133.5 | 151.4 | |
| Ohio | 201.8 | 196.4 | 191.9 | |
| South Dakota | 157.7 | 151.8 | 159.9 | |
| Wisconsin | 181.3 | 181.5 | 187.2 |
SOYBEANS (bushels per acre)
| DTN DYT-OCTOBER | DTN DYT-SEPTEMBER | DTN DYT-AUGUST | ||
| National | 52.2 | 52.3 | 52.1 | |
| Illinois | 64.5 | 65.0 | 64.7 | |
| Indiana | 61.2 | 61.6 | 61.7 | |
| Iowa | 64.7 | 64.2 | 61.8 | |
| Kansas | 35.3 | 37.0 | 38.9 | |
| Minnesota | 51.7 | 51.6 | 52.6 | |
| Missouri | 50.0 | 51.4 | 49.4 | |
| Nebraska | 61.1 | 58.6 | 55.9 | |
| North Dakota | 31.5 | 31.1 | 34.0 | |
| Ohio | 57.7 | 56.7 | 55.4 | |
| South Dakota | 45.2 | 44.8 | 45.1 | |
| Wisconsin | 53.2 | 51.6 | 52.2 |
ABOUT THE MODELS
DTN's yield models forecast at the field level using a wide array of publicly available data, such as Normalized Difference Vegetation Index (NDVI) maps, USDA crop condition reports and more. They also include DTN's proprietary weather and soil data, making them unique.
DTN's model methodology is also unique in that the models are trained on USDA Risk Management Agency (RMA) yield data, rather than monthly estimates prepared by the USDA National Agricultural Statistics Service (NASS). RMA's data is compiled using crop insurance data, while NASS surveys farmers to build its county yield estimates. RMA's county yields tend to be higher than those reported by NASS, but the differences vary by county and region. By using RMA data, DTN can generate countywide forecasts for places with limited crop production.
Recent reports of issues with ear rot and ear sprouting in corn and purple seed stain and pod splitting in soybeans are factors that aren't currently accounted for in the DTN yield model, which incorporates the joint NASA-European Space Agency's Harmonized Landsat and Sentinel-2 (HLS) satellite data.
"Those types of field-level issues are probably not something that is going to be discernible all the way up in orbit, even at a 30-meter resolution," said DTN Data Scientist Scott Williams. "HLS is the best-quality satellite source for which we have access, but it only goes back to 2016. We're currently examining ways to expand the number of years for which we have historical satellite data in the hope that it would allow the DTN model to see more seasonal extremes and better interpret what to expect given the range of possible values the crop could experience."
Williams added that in the model, historical and earlier season data can have a strong influence on predictions when DTN releases its initial yield estimates based on Aug. 1 conditions. As later season data is added, their effects on the model become smaller. Accounting for extreme late-season events, such as derechos or record-setting rainfall, is the next step in the DTN model evolution.
"One of the things we're investigating is a more nuanced use of the model feature set," he said. "Looking at specific points in the season, we might identify where a feature could have the most positive or detrimental impact. With more extreme years in the data set, we have more opportunity to identify when an extreme event is happening in the model."
Complete coverage of the 2026 DTN Digital Yield Tour can be found here: https://www.dtnpf.com/…
Read Rhett Montgomery's latest USDA reports preview here: https://www.dtnpf.com/…
Jason Jenkins can be reached at jason.jenkins@dtn.com
Follow him on social platform X @JasonJenkinsDTN
(c) Copyright 2026 DTN, LLC. All rights reserved.

