


Canada Markets
December Corn Chart Provides a Wealth of Technical Information
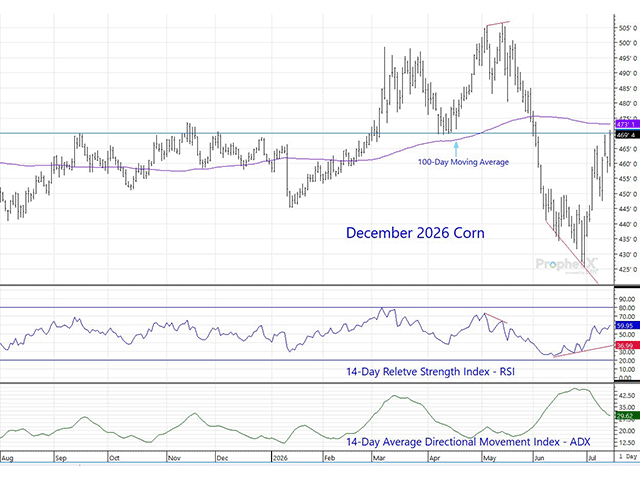
I often refer to various technical formations throughout my daily commentaries, hoping readers may have some understanding of what I'm talking about -- but knowing many may not. The accompanying December corn chart contains so many examples that it seems like it would be time well spent reviewing them.
To begin with, I should disclose my bias. I do not believe technical analysis provides all the answers on its own, just as fundamental analysis has clear limitations, and looking at the market participants themselves (through the Commitments of Traders reports) only provides rearview insight. Meaning you still must try to anticipate what various groups might do with their positions. That leaves me constantly trying to use the various tools available to come up with a theory on price direction, then adjust as necessary. The more clues that support the theory, the more confidence in it.
That said, what I would like to focus on primarily for this piece is some of the technical analysis tools widely available and used by those who aren't sure about the difference between corn, cattle, and combines. If you keep an open mind, the formations make sense when considering what market participants are doing at the time, knowing full well there are fundamentals at play the general public will never know about -- or not until well after the fact.
The most frequently mentioned is a price reversal formation, i.e. the divergence bottom (or top). In this case, the relative strength index (or RSI -- a mathematical formula comparing the average up days to the average down days and how that is changing over time -- is showing a building of internal strength, even though the price is putting in a new reaction low (in the case of a divergence bottom). See the red trendlines in June on the accompanying chart for an example.
P[L1] D[0x0] M[300x250] OOP[F] ADUNIT[] T[]
A divergence top warning sign was seen on the accompanying chart as well. The opposing red trendlines in early May highlighted the signal when the price set a new contract high, yet the RSI did not. That indicated a lack of strength, suggesting traders were already starting to work at the seasonal strategy of selling row crops when 50% of the acres are planted with few risks to be seen on the horizon. Unfortunately, you can also see very clearly why it is so popular among fund traders (in particular) due to its high success rate. Two wars (the U.S. and Iran, and Ukraine and Russia) and the related concerns over input supplies were not even enough to interfere with it.
The chart also demonstrates how a divergence bottom or top can see prices reverse after just two waves while sometimes a third occurs. The latter was the case with the bottom in June as traders weren't ready to abandon their seasonal selling strategy that early, hoping for more downside yet. But when the final push didn't uncover additional selling just as the USDA reported much-lower June 1 corn stocks than expected, traders rushed to cover some of their short positions, completing the reversal formation.
One far less commonly known indicator is found at the bottom of the chart. I don't often refer to it in my regular commentary, expecting few would know what I am talking about and trying to limit information overload. It is known as the ADX or Average Directional Movement Index. It is the result of another mathematical formula that shows how strong the momentum of a move is and how persistent the trend is. In short, when a market is moving in the direction of the dominant trend, the ADX value will be increasing (regardless of an up or downtrend). A clear example can be seen from mid-February to mid-March when the ADX climbed aggressively with the rally in price at the time. The same thing happened from mid-May until the end of June, but this time the price was trending lower. Besides simply confirming the dominant trend, the most important takeaway from the ADX is the potential exhaustion of a move. The rule of thumb is that anytime the ADX gets over 45 and turns down, the move is essentially over. It doesn't mean a reversal will be seen, but it does suggest attempts to extend the trend will not likely be successful.
As you can see from the accompanying chart, the strong outside reversal higher on June 25 was enough to turn the ADX down from almost 47. That suggested that even if there was a third leg lower in the divergence bottom, the bottom formation should hold and the six-week breakdown in price should be exhausted. And that is what was seen thanks to the help from the bullish June 1 stocks report.
While at it, I have highlighted the strong support and resistance found at $4.70/bushel (with a blue horizontal line) which has been a key level multiple times over the past year. It's worth noting that in this specific case, it also happens to be at roughly the 50% retracement level of the May-June break that is often targeted on a bounce. The market is challenging that level right now and a solid close over would clear the way to extending the rally. A reversal lower from it (like that seen on Monday) would be a bearish sign. The fact that prices recovered from the retreat from resistance on Monday is a bullish sign in itself as the weakness had been gathering attention and momentum (as seen by Tuesday's lower trade). This is where an example of the overall price theory comes in -- the dramatic escalation of fighting in the Black Sea region that risks choking off corn exports from Ukraine provided the fundamental fuel to help with the potential technical penetration of resistance.
And finally, I've included the 100-day moving average (in purple) to demonstrate how it often acts as a pivotal area where prices either turn away from it and resume their trend following a correction, or accelerate through it, confirming a reversal has occurred. Bullish traders and producers alike will be wanting to see the December corn price rally convincingly through the resistance at $4.70 and the 100-day moving average at $4.73/bushel, signaling further gains to come.
I welcome feedback along with any suggestions for future blogs. My daily comments can be found in Plains, Prairies Opening Comments and Plains, Prairies Quick Takes on DTN products.
Mitch Miller can be reached at mitchmiller.dtn@gmail.com
Follow him on social platform X @mgreymiller
(c) Copyright 2026 DTN, LLC. All rights reserved.