


Canada Markets
Large Corn Stocks Aren't So Large When Compared to Growing Demand
I've said it many times -- strong markets have participants that tend to minimize bearish news while seeking out bullish information. Weak markets see the opposite occurring with traders trying to look at almost everything through a bearish lens while ignoring bullish factors. The various grain stocks reports (and often production reports) are no exception. Going into the June 1 corn stocks report, the 5.4-billion-bushel (bb) estimate was getting lots of attention because you have to go back to the late 1980s to find a number so large.
But what gets lost in the desire to continue with the common narrative (and justify new contract low prices ahead of the report) is how much annual total use has increased over time. In financial markets, everyone agrees the Fed's balance sheet will never shrink to previous levels because there is so much money in circulation now (and economic activity) that such a small balance sheet would add unnecessary risks. So why would the same logic not apply to supplies of food?
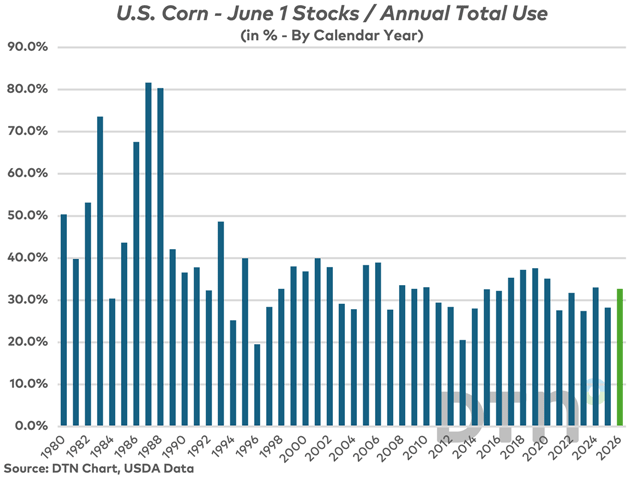
Going back to the accompanying chart, I have compared June 1 stocks of corn in the U.S. to the total demand for the year. As you can see by the green bar representing 2026's level of 32.7%, there is nothing bearish about it. In fact, it falls right in line with the 25-year average of 32% and below the 45-year average of 37.5%. That implies our safety cushion is not as large as some suggest if demand increases due to drought in Europe, or increased imports from China (for example), or supply decrease due to a super El Nino's impact on production somewhere in the world.
P[L1] D[0x0] M[300x250] OOP[F] ADUNIT[] T[]
That takes me to an interesting consideration about valuation. In 1987, June 1 corn stocks hit an all-time high of 6.332 bb at a time when only 7.757 bb was used over the entire year. That left a record high June 1 stocks-to-total-use ratio of 81.6% (compared again to this year's 32.7%). 1988 was not much better with the same stocks-to-use calculation coming in at 80.3%. The price for the 1986-87 marketing year for corn averaged $1.50/bushel, according to USDA. A horrible price no doubt with the lasting impact etched in all our brains. However, adjusted for inflation it comes out at $4.42/bushel in 2026 dollars. USDA currently estimates 2025-26 corn prices will average $4.15/bushel. And yet our June 1 stocks-to-total use is 32.7% versus 81.6% and our total use is 16.455 bb versus 7.757 bb for the respective years.
Soybeans tell a similar story. The June 1 (2026) soybean stocks came out at a slightly bearish level of 1.061 bb, only because the trade was looking for 1.046 bb and last year's 1.008 bb was slightly lower. But compared to total annual use, that only represents 24.8%. In 1987, June 1 stocks of 865 million bushels (mb) were 42.4% of the annual use of just 2.040 bb. Yet the average annual price according to USDA was $4.80/bushel at the time. Adjusted for inflation, that would be $14.20/bushel in 2026.
So, the next time you hear commentary on how large stocks or production are, it may be worth asking yourself how that compares to the demand side of the equation.
I welcome feedback along with any suggestions for future blogs. My daily comments can be found in Plains, Prairies Opening Comments and Plains, Prairies Quick Takes on DTN products.
Mitch Miller can be reached at mitchmiller.dtn@gmail.com
Follow him on social platform X @mgreymiller
(c) Copyright 2026 DTN, LLC. All rights reserved.