

Todd's Take
Wheat Prices and the Instability of One-Way Markets
It's no secret that U.S. wheat prices are in a slump. I'm not here to bemoan the fact, but I do think it has become an interesting situation that deserves watching. For starters, March KC wheat closed at $6.24 1/4 Wednesday, Nov. 22, near its lowest March price in over two years. DTN's National Hard Red Winter (HRW) Wheat Index closed at $5.52 per bushel the same day, a price that, before this year, was last seen in early 2021.
For the first seven months of 2023, March KC wheat prices experienced normal two-way trade with buyers and sellers trading prices in a range from roughly $7.50 to $9. The Black Sea Grain deal was in effect for most of that time and Ukraine was successfully moving corn, wheat and other goods out of the country through the Black Sea.
After Russia pulled out of the agreement on July 17, March KC wheat rose to $9.27 1/2 and it looked like the start of a possible new uptrend with concerns that Ukraine could lose half of its ability to export wheat. The possible uptrend turned out to be a market peak as funds that were net long over 23,000 contracts of KC wheat on July 25 began selling and never looked back. Almost four months later, March KC wheat is down 33% from the July high, spending all but two days of that stretch below the 20-day average.
The 20-day average is a relatively short-term marker and prices don't normally spend much time on just one side of it. Looking at historical charts, it is common to see a rotation of prices above and below the average, as both sellers and buyers participate in the oscillating process of transferring wheat supplies from producers to consumers. In this case, I had to go back nine years to find the last time prices were so one-sidedly bearish for this long.
P[L1] D[0x0] M[300x250] OOP[F] ADUNIT[] T[]
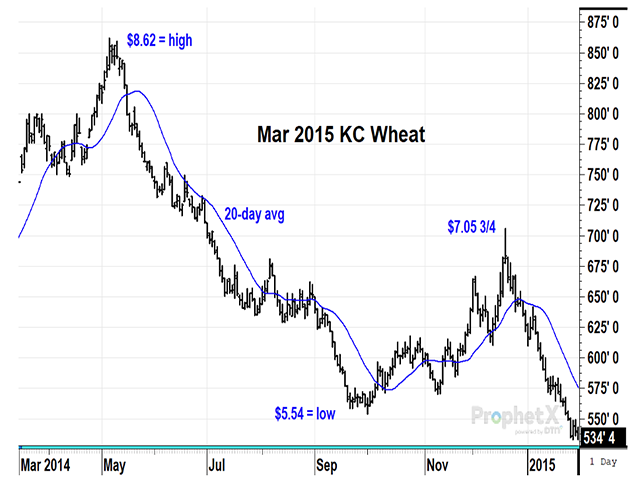
On May 6, 2014, the March 2015 KC wheat prices peaked at $8.62 per bushel, a time when the southwestern Plains were stricken by extreme drought. HRW wheat conditions weren't ideal that year but did improve enough for the U.S. to harvest 739 million bushels (mb) of HRW wheat in 2014, an important part of U.S. wheat production that totaled 2.026 billion bushels (bb) that year. By Oct. 1, March KC wheat fell to a low of $5.54, a nearly five-month slide that showed prices closing below the 20-day average in all but seven days of decline.
Coincidentally, the ending stocks-to-use ratio for U.S. wheat was 37% in 2014-15, the same as in 2023-24, but that is where the similarities end. In 2014-15, the U.S. exported 854 mb of wheat, the third most behind Europe and Canada. In 2023-24, the U.S. is struggling to export 700 mb, a possible fourth place in a world market dominated by Russia. Russia has had four record wheat crops in the past eight years and just produced a near-record crop in 2023. On Wednesday, the International Grains Council reported Russia still offers the lowest wheat prices among the world's major producers.
So, what happened to the price of March KC wheat in 2014 after trading for nearly five months below the 20-day average and hitting a low of $5.54 on Oct. 1? Like what we've seen in 2023, commercials responded to wheat's lower prices and turned net long in mid-September. After Oct. 1, prices reversed and rallied to a high of $$7.05 3/4 by Dec. 18, a five-month high and just a couple of cents short of a 50% retracement. USDA's ending stocks estimate for U.S. wheat of 698 mb in September 2014 was trimmed to 654 mb by the December report but wasn't enough to explain a $1.50 rally.
I contend that the seeds of the $1.50 rally in 2014 were a normal reflex to the five months of one-way trading in which prices were largely held below the 20-day average with few exceptions. As I tried to explain in this space in 2019 (see https://www.dtnpf.com/…), price rotation is such a strong aspect of market behavior that over a recent 59-year period, spot wheat prices reached a three-month high in 57 of the years and a six-month high in 52 of the years. Even when markets are fundamentally bearish, some price rotation is normal.
Funds are net short 37,742 contracts of KC wheat as of Nov. 14, the largest short position since June 2020, and the illusion of 189 mb of fake supply in the market that must be bought back at some point. Commercials are net long 28,759 contracts of KC wheat, near their largest position since 2020. I don't make guarantees and I don't know yet what might trigger a rally this winter, but I do recognize an unstable market situation when I see one. Fundamentally, the vitals don't look promising for U.S. wheat producers, but judging by recent price behavior, there is a glimmer of hope for higher prices ahead.
**
Comments above are for educational purposes only and are not meant as specific trade recommendations. The buying and selling of grain or grain futures or options involve substantial risk and are not suitable for everyone.
Todd Hultman can be reached at Todd.Hultman@dtn.com.
Follow him on X, formerly Twitter, @ToddHultman1.
(c) Copyright 2023 DTN, LLC. All rights reserved.